4 of the 5 Most Active Grocery Retailers are PopStats Customers

Here’s why.

4 of the 5 Most Active Grocery Retailers are PopStats Customers

Here’s why.

“Click and Carry” (pickup) is fueling e-commerce for grocery retailers across the nation. This new trend isn’t showing any sign of slowing down, but the fight for the perfect store location is still being fought. 

BuildCentral recently released an article listing 2021’s Top 5 Most Active  Grocery Retailers in America. It dives into the topic that regardless of the digital age, grocery stores are still ramping up construction of their brick and mortar stores.

Out of the 5 grocers listed in the article, 4 trust STI: PopStats™ to power their market strategy and site-location decisions.  These top grocers use PopStats because it is the most up-to-date and accurate geospatial dataset on the market.  

This article will dive into the different reasons why they choose PopStats and other Synergos datasets again and again.

Want a free sample of PopStats? Contact us today!

Get A Free Sample

“By applying variables from PopStats, like income, age, and ethnicity, to our analysis, we can do that, even at lower geographic levels — and with extreme confidence.”
“…with PopStats we’ve found that the data stays consistent and the error rate stays small. This is important to us because the more accurate the data is, the better informed our decisions are.”

Here at Synergos Technologies, we work under a policy we call, “ACT.” 

  • A – Accuracy
  • C – Comprehensive
  • T – Timely

Everything we create and do must fall under these three pillars. They help us to create quality products and services that maintain our status as industry leaders. Let’s dive into how our full data suite falls into these pillars. 

Accuracy

Many PopStats customers use our datasets due to their accuracy and dependability. Those attributes come from proven methodologies that allow you to make confident decisions. 

There are many different ways are able to check data quality and ensure accuracy in every release. One way is through a “Q&A” process. This is a robust process that involves testing the final product with proprietary procedures before we release the product. We are also constantly creating maps and graphs to see if we can catch any data discrepancies (we like to post our most interesting discoveries online).

Another way we prove the effectiveness of our methodologies is by comparing our estimates to Census and ACS numbers. Our Accuracy whitepaper shows the numbers and how close our population estimates were to the 2010 census.  PopStats counted 99.998% of the United States population. Fast forward 10 years to the 2020 census and PopStats counts 99.993% of the population. That’s 20+ years of exceptional accuracy that our competitors aren’t able to achieve.

Out of anyone else in the industry and our competitors. Our estimates were the closest to the Census results. We were even closer than the Census’s own preliminary estimate.

Comprehensive

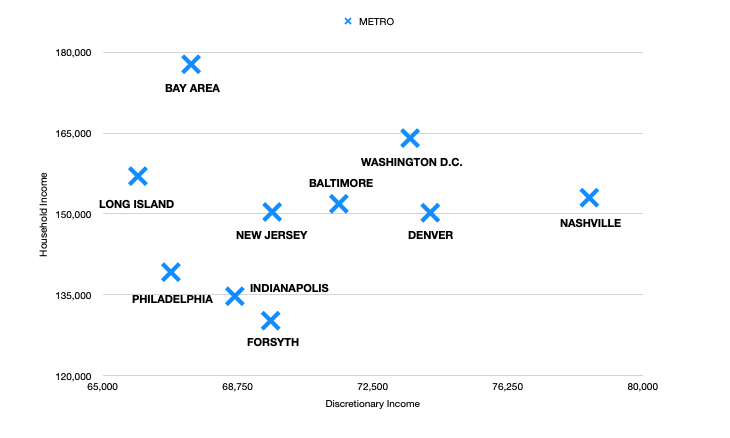
Comprehensive to us means that we have so many unique, accurate, and updated variables, that you will be able to extensively understand your site-selection research. A few unique variables we create are religion, discretionary income, and economic variables like GDP and mortgage risk. PopStats has the largest selection of fields in a single demographic product (over a thousand), and we update it quarterly.

Moving along, every variable in our datasets is backed by trusted and official sources. Most use more than one source! Some sources that our datasets use are:

You can contact us if you’re interested in learning about our full list of data sources.
 
We then use proprietary mathematic models to shape the data into estimates. All of these steps create robust datasets that can be used to effectively make decisions beyond site location like what items to stock on the shelves or what kind of advertising would be effective in an area. The opportunities are endless.
 

Timely

Uniquely, in the realm of demographic estimates, PopStats is the first and only dataset to be released quarterly. No other data provider can duplicate that process a the level of accuracy we do it at. The struggle with that is on-time releases. Synergos Technologies is proud to say that of our 25+ years in business we have never been late on a PopStats delivery. We understand our customers are working diligently to find the best sites for their new store locations. That’s why we also work diligently to make sure they have the tools they require when they need them.

Another factor in our reliability is our industry-leading customer service. Being able to pick up the phone and talk to a person immediately is a thing of the past for most businesses. Not with us. We always have someone at the phone ready to answer questions immediately during business hours. Additionally, we have created multiple points of access to our customer service like email and our new website chatbox. Our excellent system allows us to be proud to say that all customer inquiries are answered within a day of contact, and often within the hour. 

Interested in learning more? Contact us today!

Learn More About PopStats

– Extra Material –

The Most Livable Counties – A Discretionary Income Analysis

Consumer spending habits and discretionary income determine the quality of life for many Americans. Which counties are experiencing the best?

The Most Livable Counties – A Discretionary Income Analysis

Consumer spending habits and discretionary income determine the quality of life for many Americans. Which counties are experiencing the best?

America is beginning to return to a more normal state of living. Now that the COVID-19 pandemic is seemingly coming to an end, consumer spending is beginning to increase again. We used STI: PopStats™ data to analyze average household incomes and discretionary incomes to determine where the most livable cities/areas across the country are, and to see where spending is likely to increase the most. 

The ranking for the following cities/areas was determined by comparing average discretionary income versus the average household income in a county. The counties with the most discretionary income to spend on goods not considered necessities are ranked higher. With consumer spending ramping back up in America, the areas with more discretionary income will be spending more than others. 

Along with our rankings, we included economic indicators unique to the PopStats product like ‘Gross Domestic Product’ and ‘Mortgage Risk.’ These unique variables give further insight into our clients’ potential customers and their custom customer profiles. Mortgage risk is an interesting variable in that it rates an area on its chances of defaulting on a mortgage from 1 to 5, 5 being most likely and 1 being least likely.

All numbers and figures used in this analysis are sourced from STI: PopStats™. Contact Us to learn more about the 1000’s of variables we update quarterly.

Most Livable Counties in the United States

10. Nassau County – Long Island Area

  • Population: 1,356,138
  • Average HH Income: $157,016
  • Average Discretionary  Income: $65,977
  • GDP per Capita: $111,661
  • Mortgage Risk: 3.2672
  • Average Disposable Income: $107,841

This county is the first county outside of New York City. A theme that you are going to notice through the rest of this analysis is that “most livable cities” are actually areas right outside of thriving metropolitans. These professionals are benefitting from high salaries and then escaping back to more affordable real estate. This combo allows for more discretionary income worth the extra time spent in the car.

9. Philadelphia – Chester County

  • Population: 533,178
  • Average HH Income: $139,215
  • Average Discretionary Income: $66,893
  • GDP per Capita: $91,027
  • Mortgage Risk: 2.7338
  • Average Disposable Income: $99,520

With a population of over 500,000, Chester county hosts several cities that are reaping the benefits of having a manageable drive time to Philadelphia. 

8. The Bay Area

  • Population: 3,816,251
  • Average HH Income: $177,761
  • Average Discretionary Income: $67,454
  • GDP per Capita: $148,538
  • Mortgage Risk: 3.9355
  • Average Disposable Income: $118,504

Several counties in the bay area made the cut. This analysis is comprised of the following counties: Marin, San Mateo, Santa Clara, San Francisco.

It’s not a common thought to think of the bay area as livable with their housing crisis and homeless problem the area faces; however, looking at the data shows that those employed (especially in the booming tech industry) are able to fully utilize everything the area has to offer.  

The bay area has the highest average household income on the list as well as the highest GDP per capita. The affordability of the city plays a heavy role with the fact that this area has the highest difference between income and discretionary income. 

7. Indianapolis – Hamilton County

  • Population: 353,562
  • Average HH Income: $134,750
  • Average Discretionary Income: $68,669
  • GDP per Capita: $81,691
  • Mortgage Risk: 2.7086
  • Average Disposable Income: $97,894

Hamilton County is what you can consider a “healthy economy.” Their economic vitality score places them right on par with the national average. This along with high spending potential make it a solid area to live. 

6. Forsyth County, GA

  • Population: 253,007
  • Average HH Income: $130,218
  • Average Discretionary Income: $69,663
  • GDP per Capita: $81,203
  • Mortgage Risk: 3.0771
  • Average Disposable Income: $100,934

Although this is the most rural county on our list, their incomes and spending power allow them to put up a good fight. Forsyth County has the highest economic vitality index on the list but the lowest GDP per capita. 

5. New Jersey (New York Suburbs)

  • Population: 824,369
  • Average HH Income: $157,070
  • Average Discretionary Income: $69,707
  • GDP per Capita: $106,938
  • Mortgage Risk: 2.8996
  • Average Disposable Income: $108,721

This is another area with several counties making this top cities list. The counties included are Morris and Somerset.

A commute from a Jersey town to the bustling island of Manhattan is a pop culture reference at this point. With their close proximity to high incomes and the availability of more affordable real estate, it’s not hard to believe these counties host some of the most livable cities. 

4. Baltimore – Howard County

  • Population: 330,939
  • Average HH Income: $151,890
  • Average Discretionary Income: $71,558
  • GDP per Capita: $90,908
  • Mortgage Risk: 3.2304
  • Average Disposable Income: $110,736

This county has an advantage that no other county on this list has. This county is sandwiched between two major metropolitan cities (Baltimore being the closest). The residents of this county get to benefit from both Washington D.C. and Baltimore.

3. Washington D.C. – Loudoun and Fairfax County

  • Population: 1,556,521
  • Average HH Income: $164,066
  • Average Discretionary Income: $73,537
  • GDP per Capita: $92,160
  • Mortgage Risk: 3.4726
  • Average Disposable Income: $116,647

The capitol city is hosting quite a few different neighboring counties on this list. Loudoun and Fairfax are benefitting from the city the most. These counties are enjoying healthy economies. The discretionary incomes in these areas are mirroring some people’s entire income. 

2. Denver – Douglas County

  • Population: 367,726
  • Average HH Income: $150,232
  • Average Discretionary Income: $74,097
  • GDP per Capita: $81,981
  • Mortgage Risk :3.4863
  • Average Disposable Income: $110,941

For a city of its size, Denver has a relatively high cost of living. That does come with some great salaries. The neighboring counties, like Douglas, are the ones taking the most advantage of that. 

The most livable county in America:

1. Nashville – Williamson County

  • Population: 250,620
  • Average HH Income: $153,023
  • Average Discretionary Income: $78,515
  • GDP per Capita: $98,173
  • Mortgage Risk: 3.2665
  • Average Disposable Income: $112,789

Austin didn’t make the top 10 in a city list? Not this time. A Nashville county currently holds the rank as the most livable city in America according to our discretionary income data. Between the cost of living and the cost of real estate in Tennessee, residents are able to afford to shop and spend lavishly. 

scatter plot of the top 10 liveable counties

Everyone’s definition of the most livable city/county will be different. Spending on necessities takes a large portion of our annual salaries. The money that is left over is what we can spend on pleasantries and entertainment like vacations, luxury goods, gifts, etc. Having the ability to spend on activities and goods like that are what make cities livable and popular. 

Using variables like discretionary income and comparing them to staple variables like household income and mortgage risk can make for effective customer profiles and city stories. Combining different datasets and cross analyzing data is how you make effective and profitable site-location and related decisions. 

STI: PopStats and STI: Spending Patterns made this analysis possible. Contact us to learn how you can put our data to work for you.

Put Data into Action