Labor
Number of Workers in Family
The Las Vegas, NV-AZ has an average of 1.4 workers per family. This market subsequently ranks 96th in the number of workers per family across the 167 STI Markets. It has a location quotient of 0.96 time the national average of 1.5.
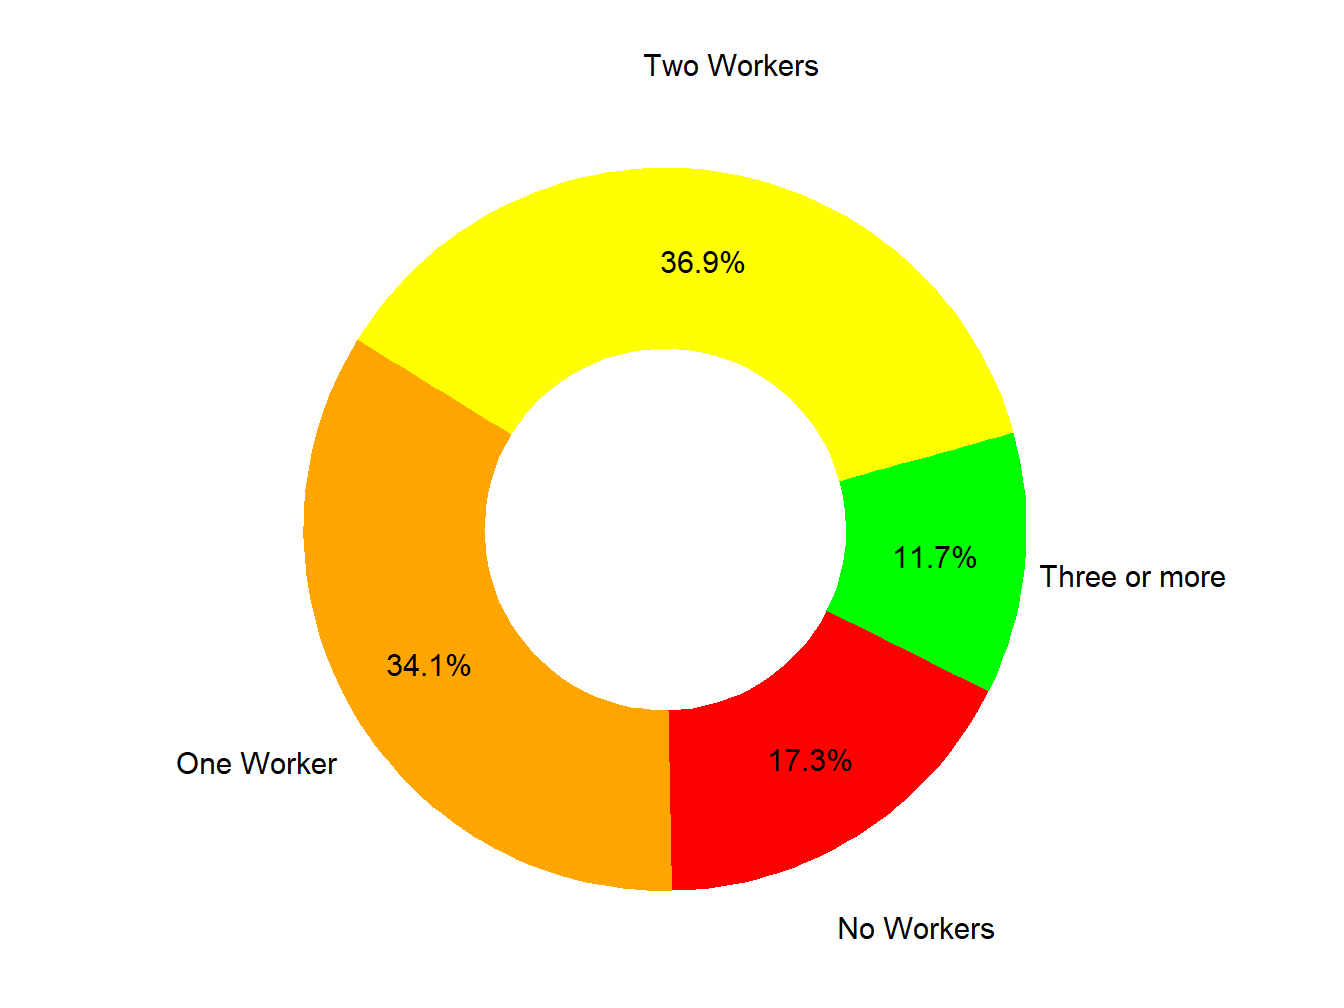
Figure 31: Workers In Family
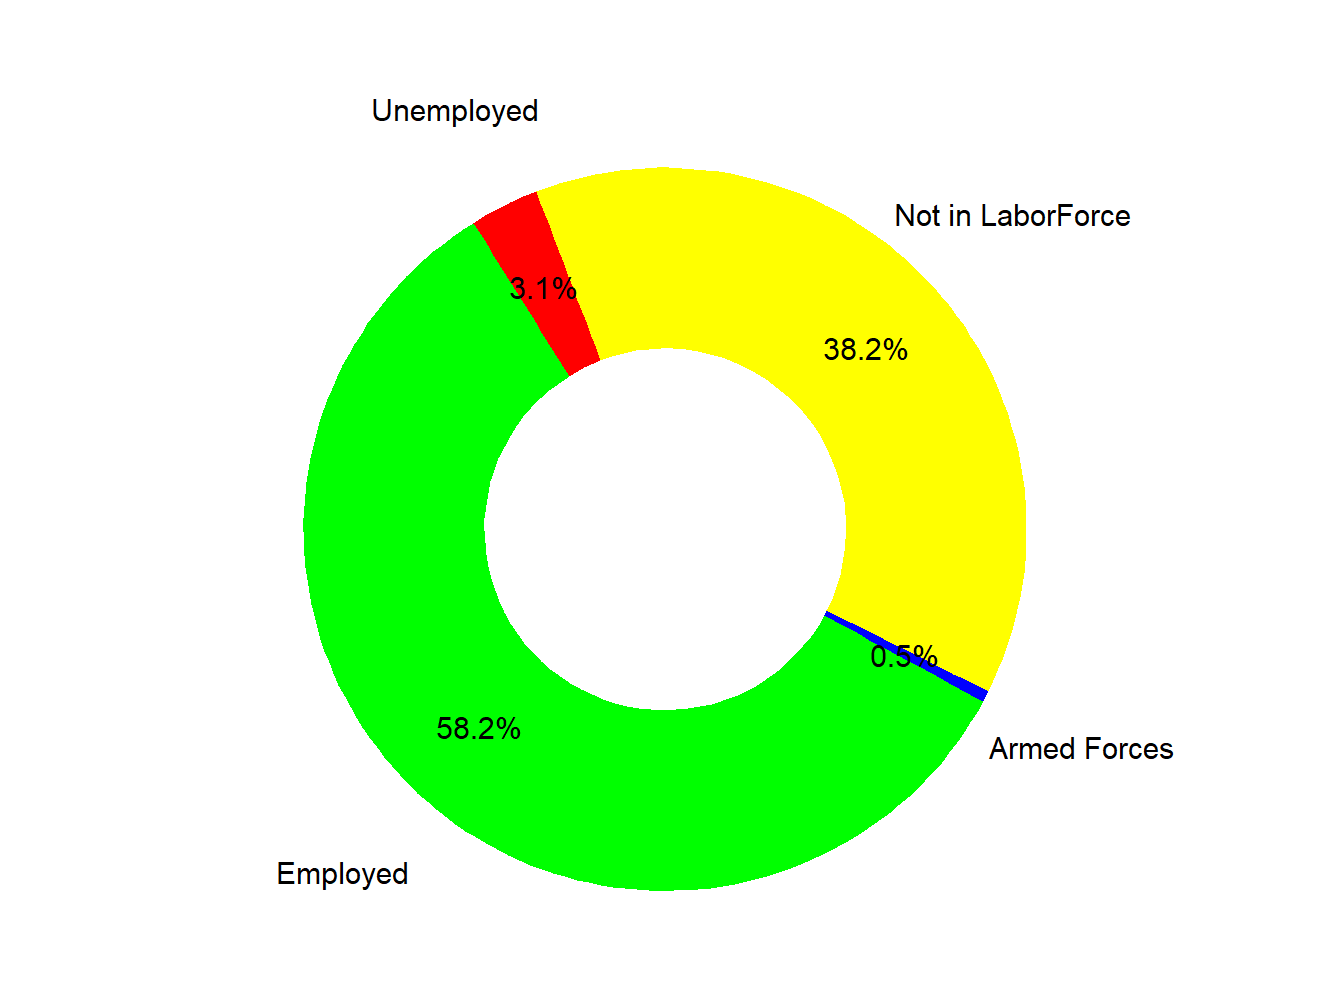
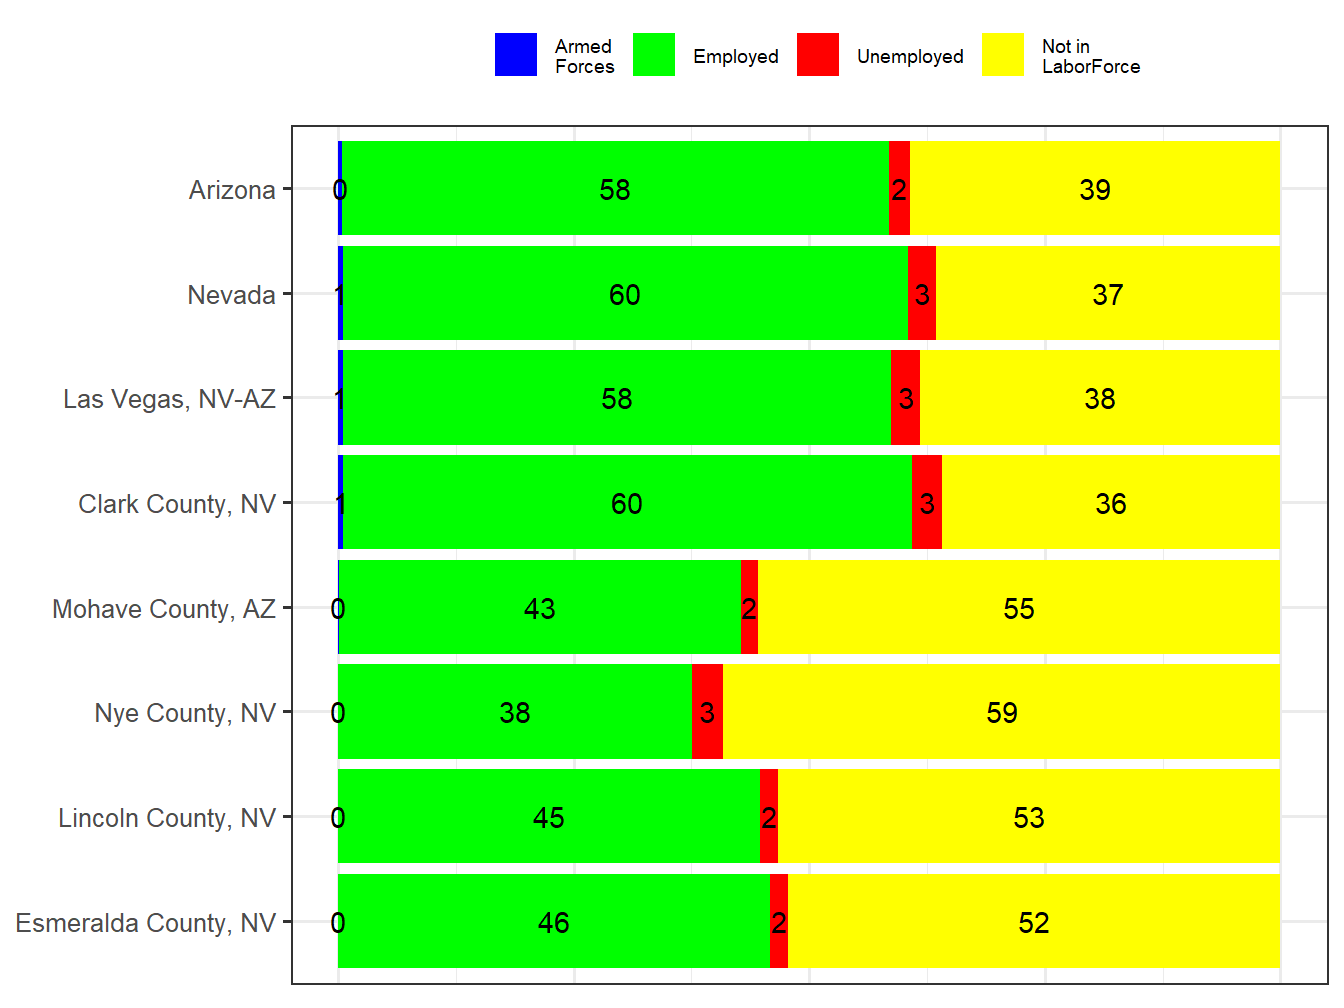
Labor Force
The Las Vegas, NV-AZ ranks 86th in labor force participation among the 167 STI Markets with 61.6% of those 16 plus in the labor force. Of those in the Labor force 0.91% are in the Armed Forces a value 1.15 times the national average resulting in an Armed Forces employment ranking of 41st across STI Markets.
In terms of overall employment size, the market ranks 127th with employment of 1,303,037.
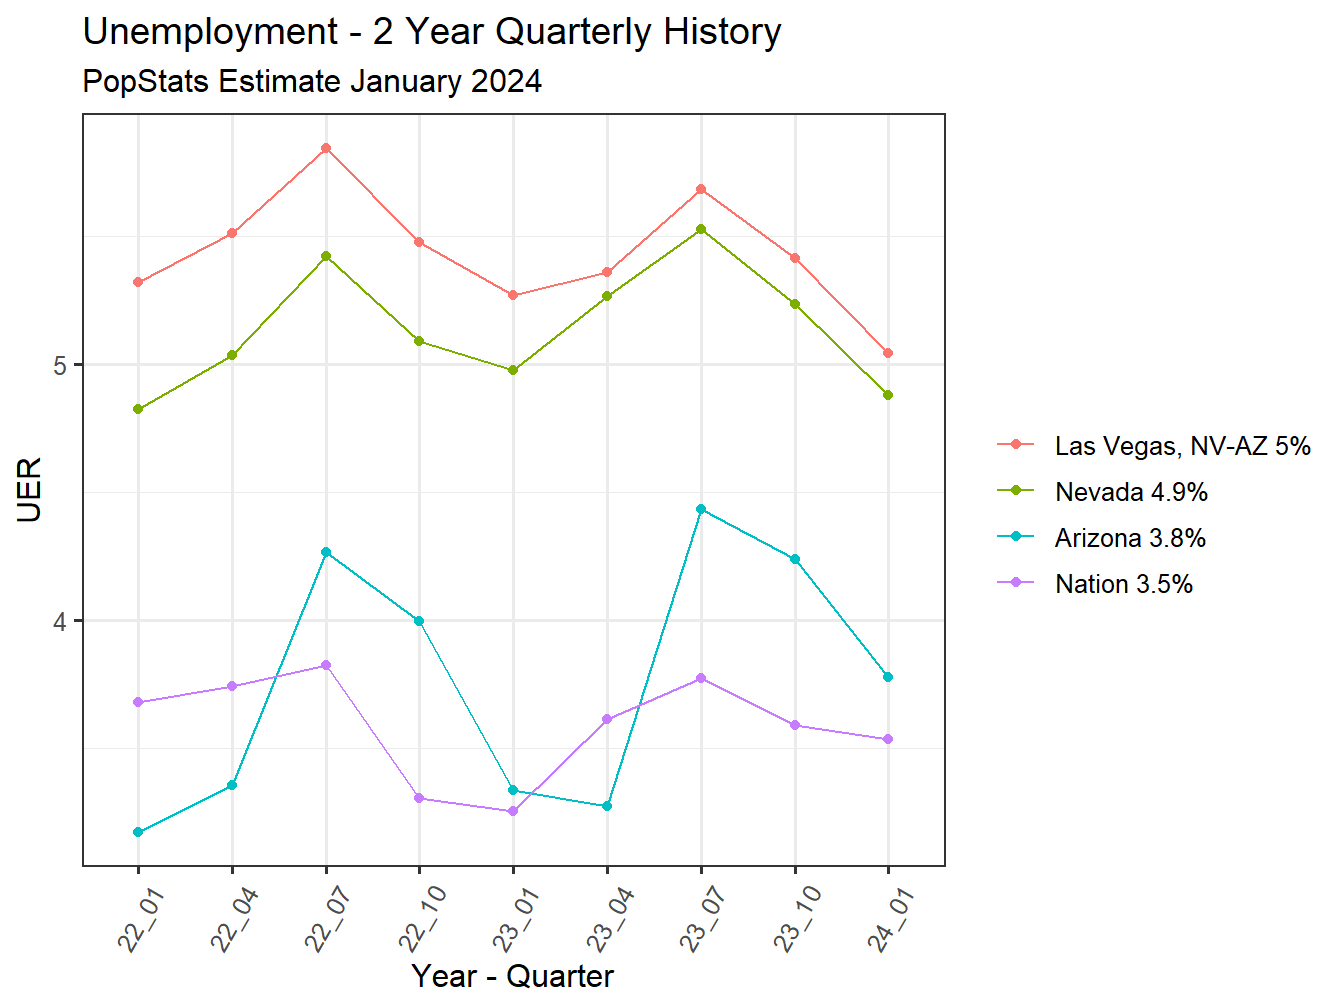
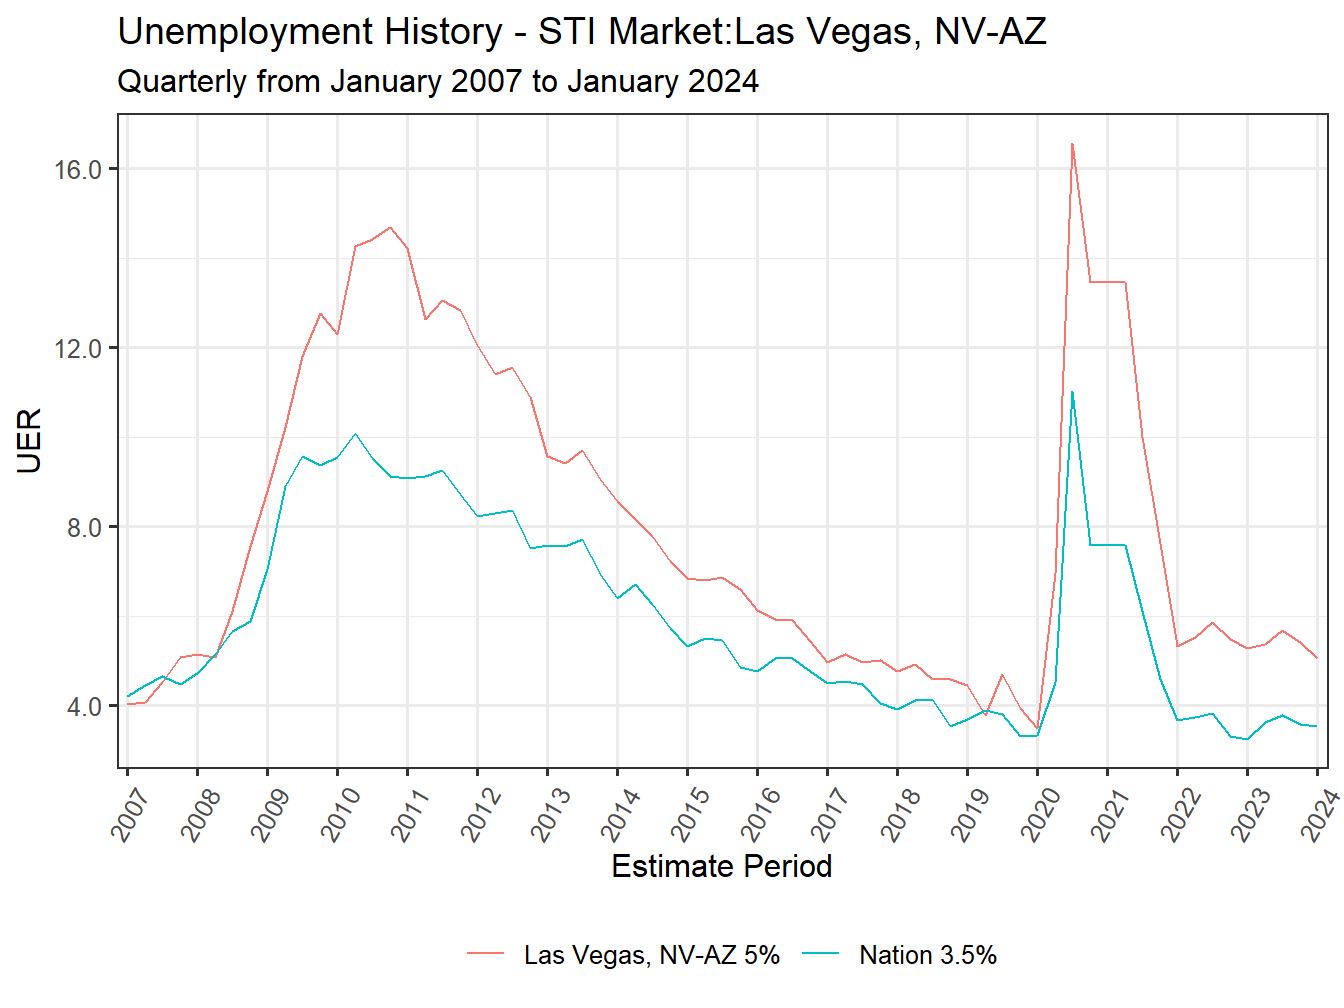
Unemployment Rate of 4.9%
With an Unemployment Rate of 4.9% the Las Vegas, NV-AZ currently ranks 27th in Unemployment among the 167 STI Markets.
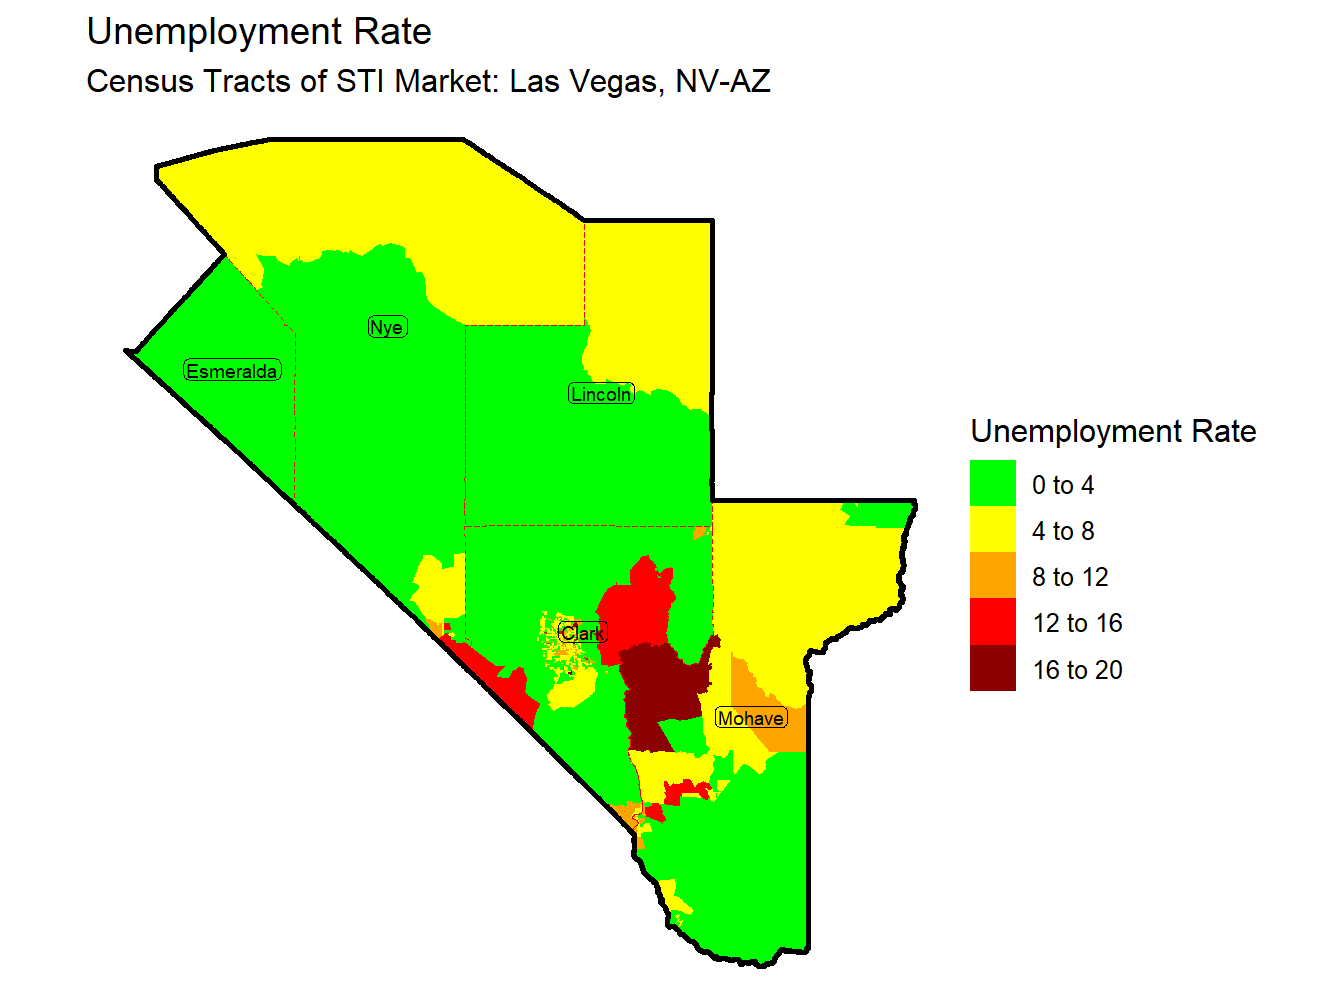
UER Inequality - Moderate
The Las Vegas, NV-AZ can current be classified as having Moderate level of variation across its Census Tracts. This classification is based on the Gini Coefficient of the market which is currently 0.322. Low (0 to .3), Moderate (.3 to .4), High (.4 to .6), Extreme (.6 to 1). The Gini Coefficient is often used to classify inequality. Across all STI Markets the Las Vegas, NV-AZ ranks 160th. The interquartile range of the markets Census Tracts, that is its 25th percentile and 75th percentile values, are 2.9% and 6.7%, respectively.