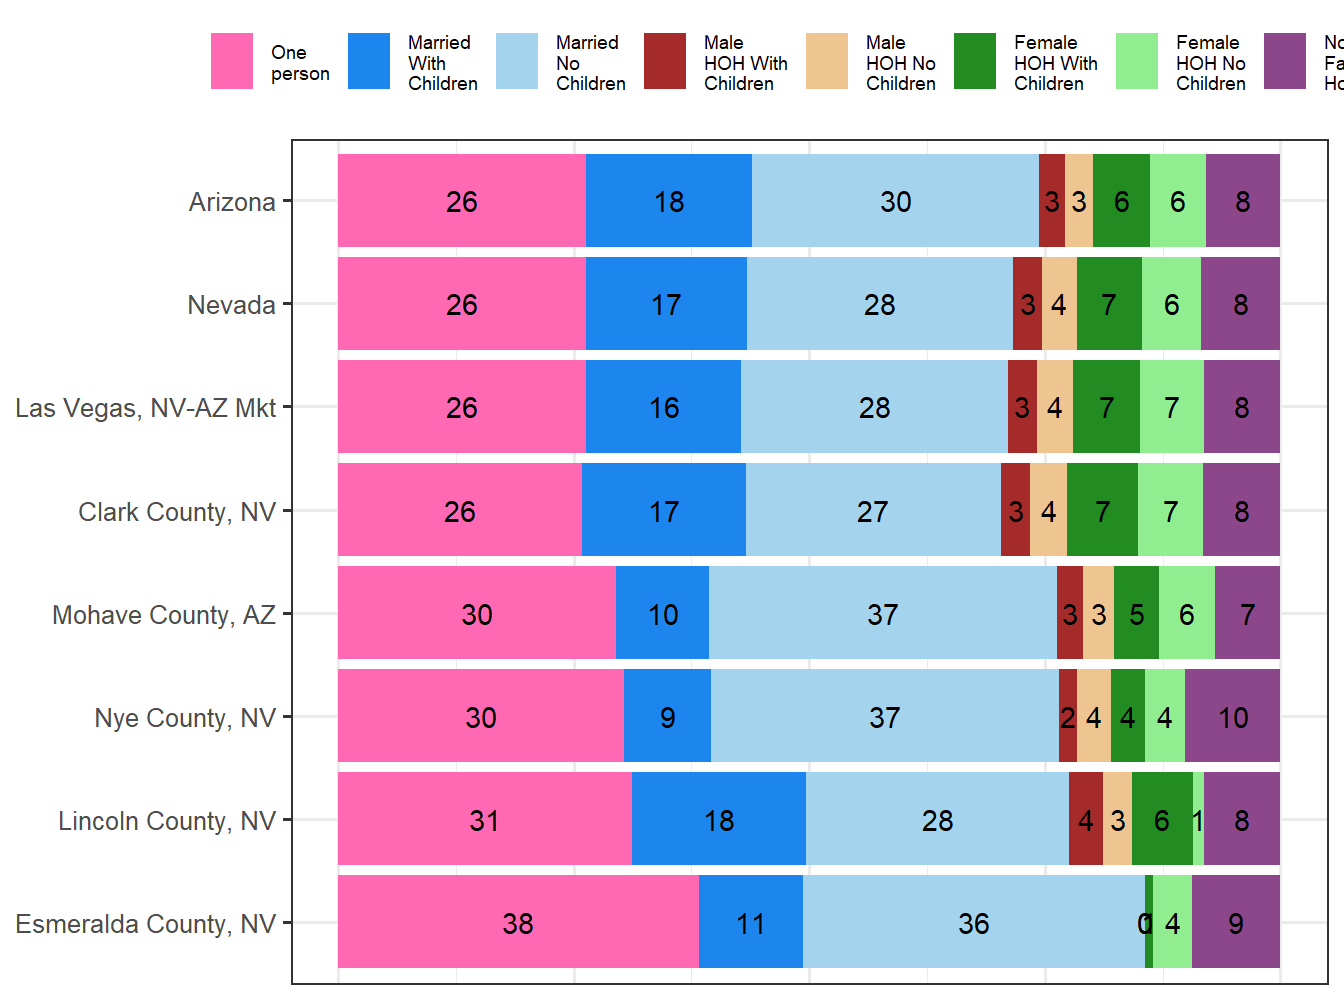
Age and Family Structure
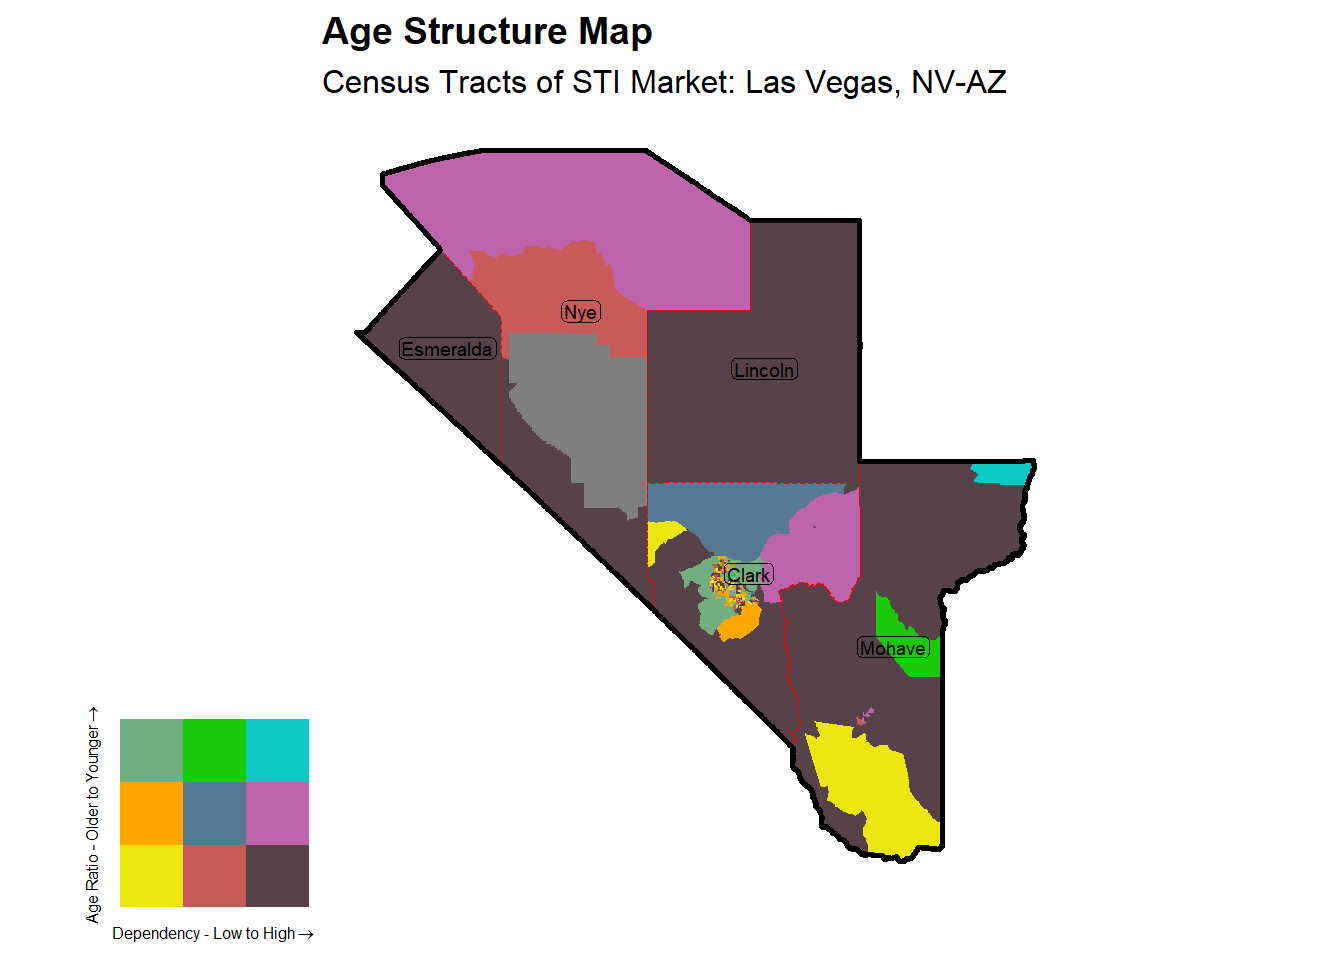
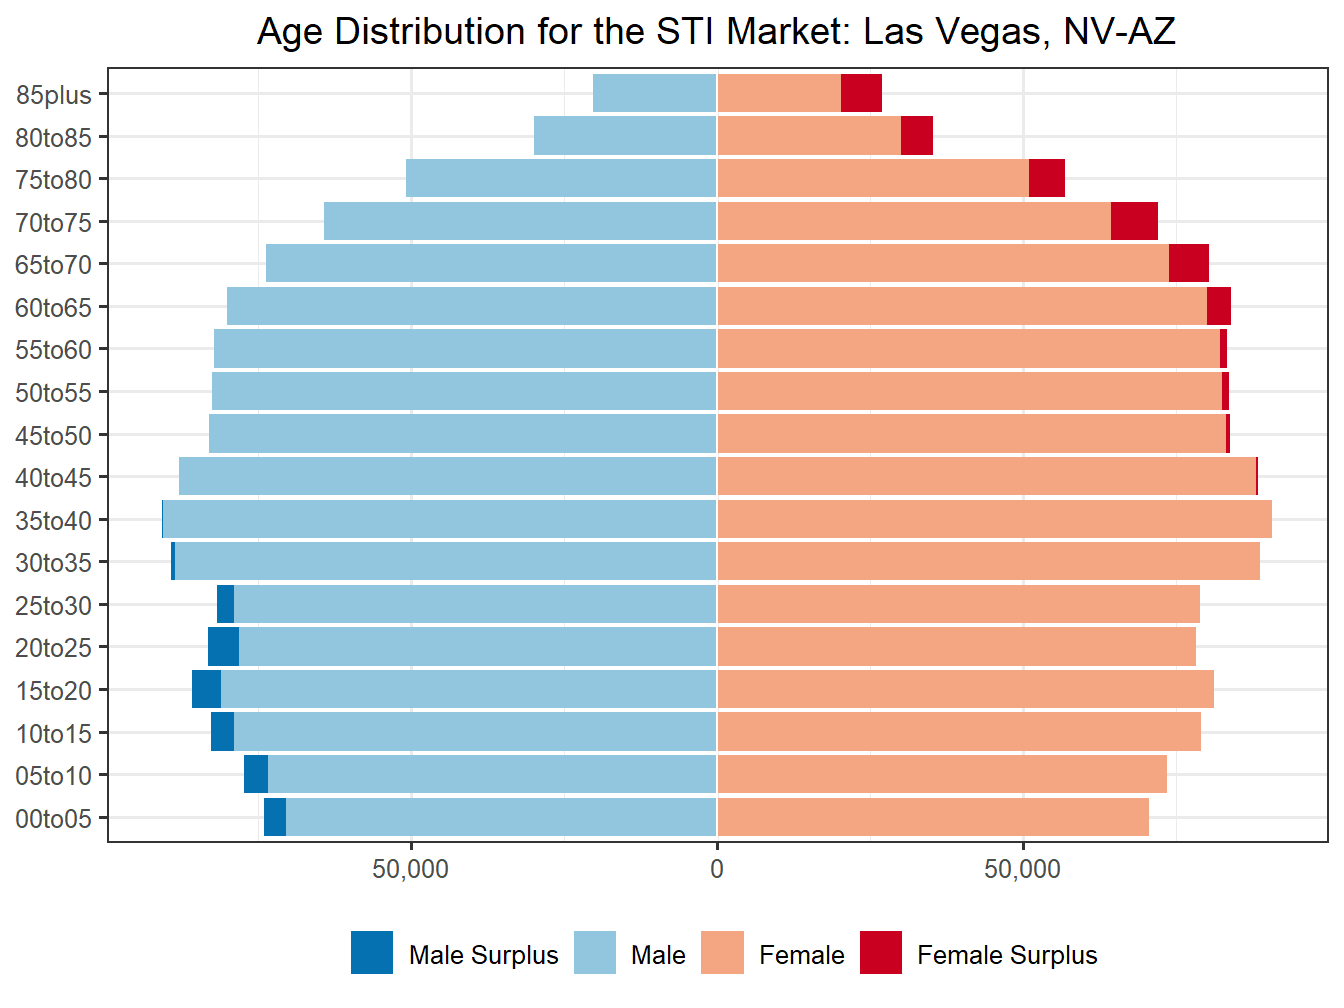
This report looks at the Age distribution of the Las Vegas, NV-AZ and quantifies the structure in to 9 possible categories. These are based on 2 scales, Dependency and Age Proportion Ratio of the Dependency. Dependency here is the ratio of dependent population, include older dependents over 65 and younger dependents under 15 compared to the 15 to 65 working age population. This measure is often used a way of quantify the amount of strain that the working age population might have in supporting those not working and is sometimes further refined to focus on only those currently working. In this case however we focus only on the age structure. The percentage that the young make up of the dependent population yields the Dependent Age Proportion, with a higher value indicating a younger population.
Market Age Structure Classification: Stable
The Las Vegas, NV-AZ market has a dependency ratio of 58.4 which is considered a Medium level of dependency. The proportion of that dependent population that is under 15 is 46% and subsequently this market could be age wise considered Balanced. These two classifications in mind the Las Vegas, NV-AZ market falls in the Stable Age Structure Classification.
With a Medium level of dependency and the age dependency balanced between young and old, this markets is fairly stable. Stability in a market is often a good condition, striking a balance between economic growth and still maintaining enough population growth to insure the market does not face an aging crisis in the future. Unless this market has the excess means to expand via development of housing and employment opportunities its biggest focus should likely be to continue in this Stable structure. As many markets across the US are faced with lower birth rates, keeping that rate up and retaining and encouraging young migration will be necessary. If that young population becomes too squeezed for potentially limited housing and employment options they may seek opportunity elsewhere. That could lead this market to a Temporary Prosperity structure that can last only so long or even a less ideal Aging Rapidly structure. Baring any further ability to expand the hope would be that this market can remain in a Stable structure.
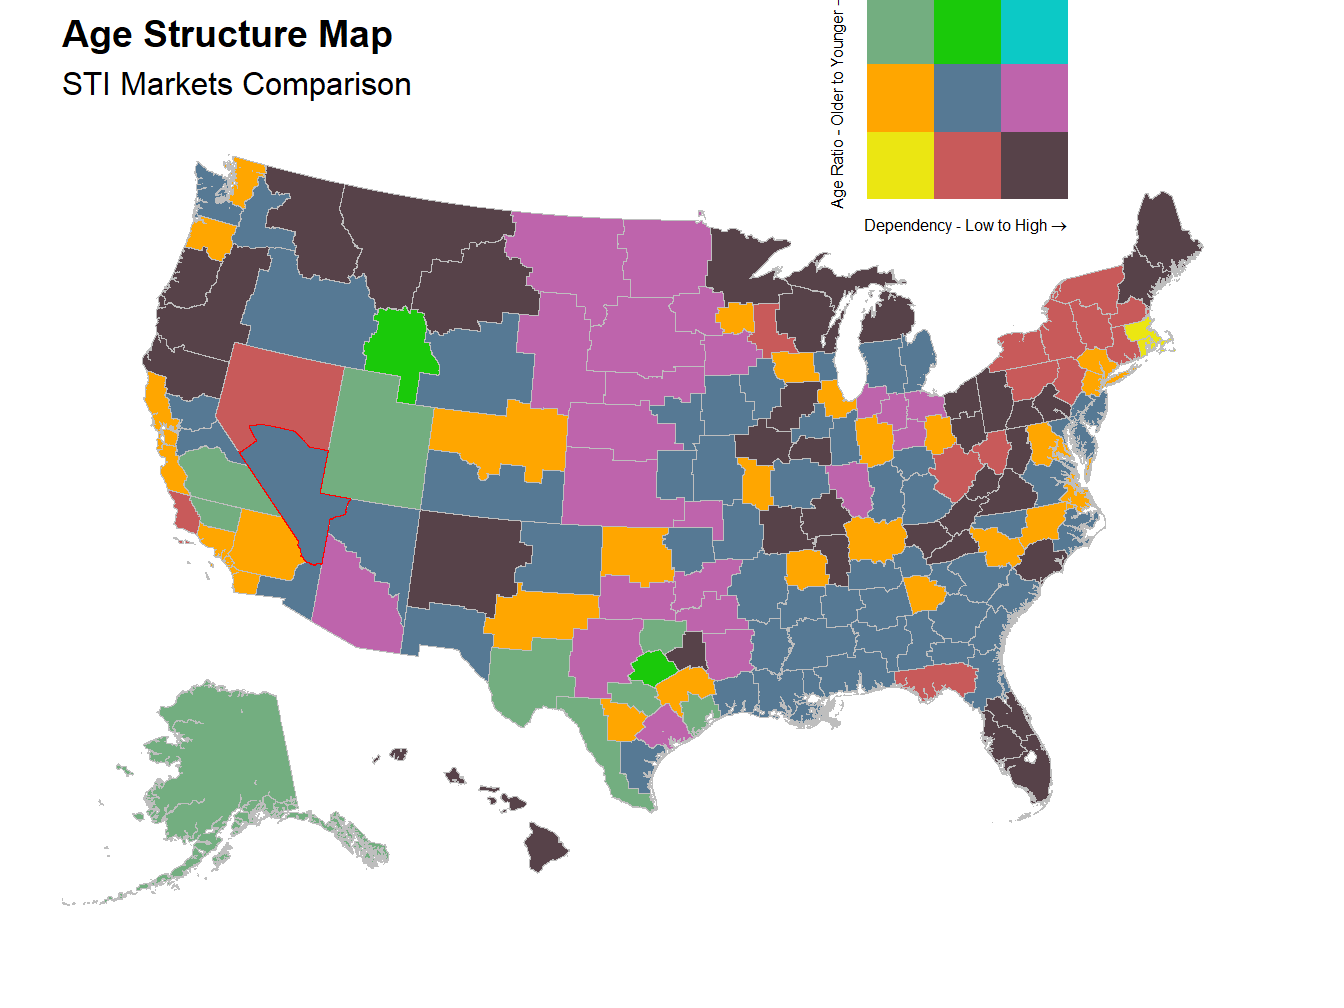
STI Markets Comparison - Age Chart
The lines on the following chart are the break points used for structure classifications. For dependency on the X axis they are 56 and 61. For the age proportion of younger dependents (out of young <15 and old dependents >65) on the Y axis they are at 55% and 45%.
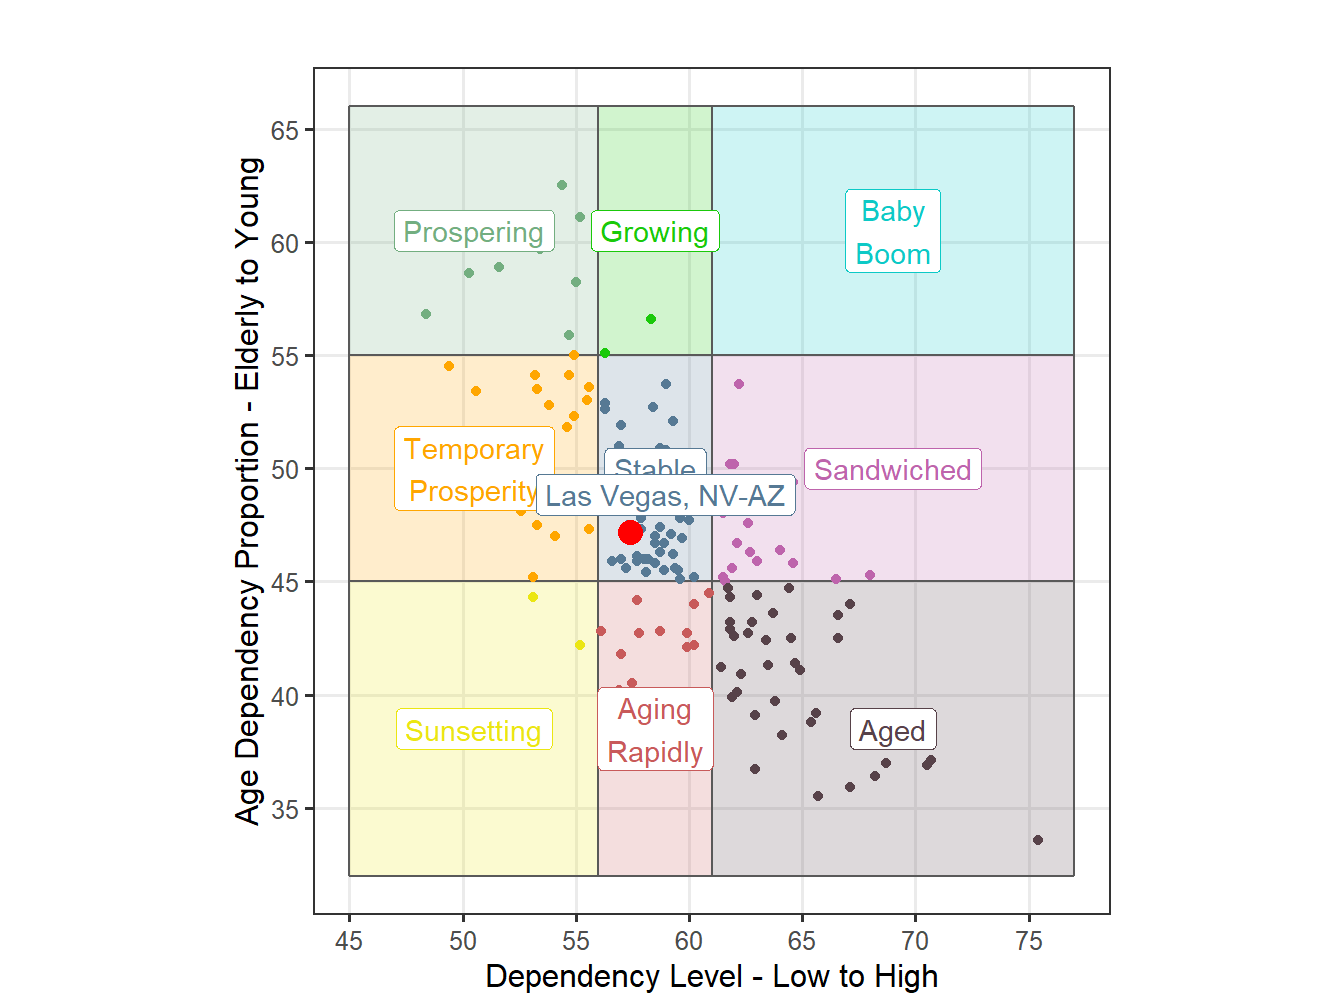
Figure 17: Age Structure Classification for STI Markets