Commute
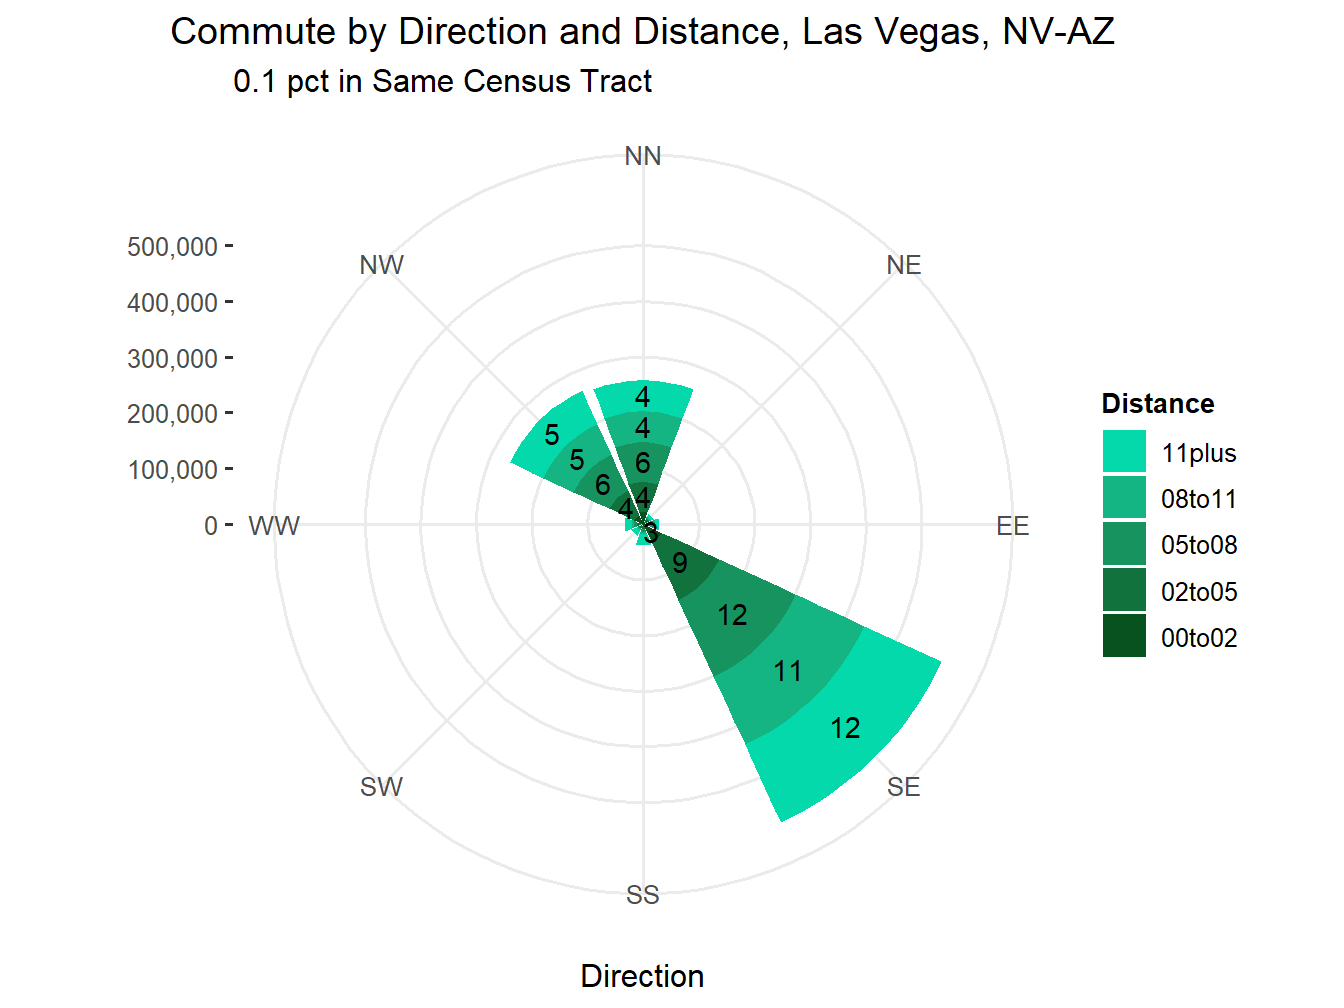
The Primary Direction of travel to work for the Las Vegas, NV-AZ Market is South East followed by North West. The market ranks 140th with an average distance of 7.8 Miles.
Commute Pattern
The following shows the commute to work patterns for the Las Vegas, NV-AZ Market. The average direction is found via a circular mean function. The concentration is the proportion of overall travel headed in that direction and those adjacent to that direction. Length of arrow is scaled by the distance traveled. Together this allows for a general view of how traffic flows around the market each morning.
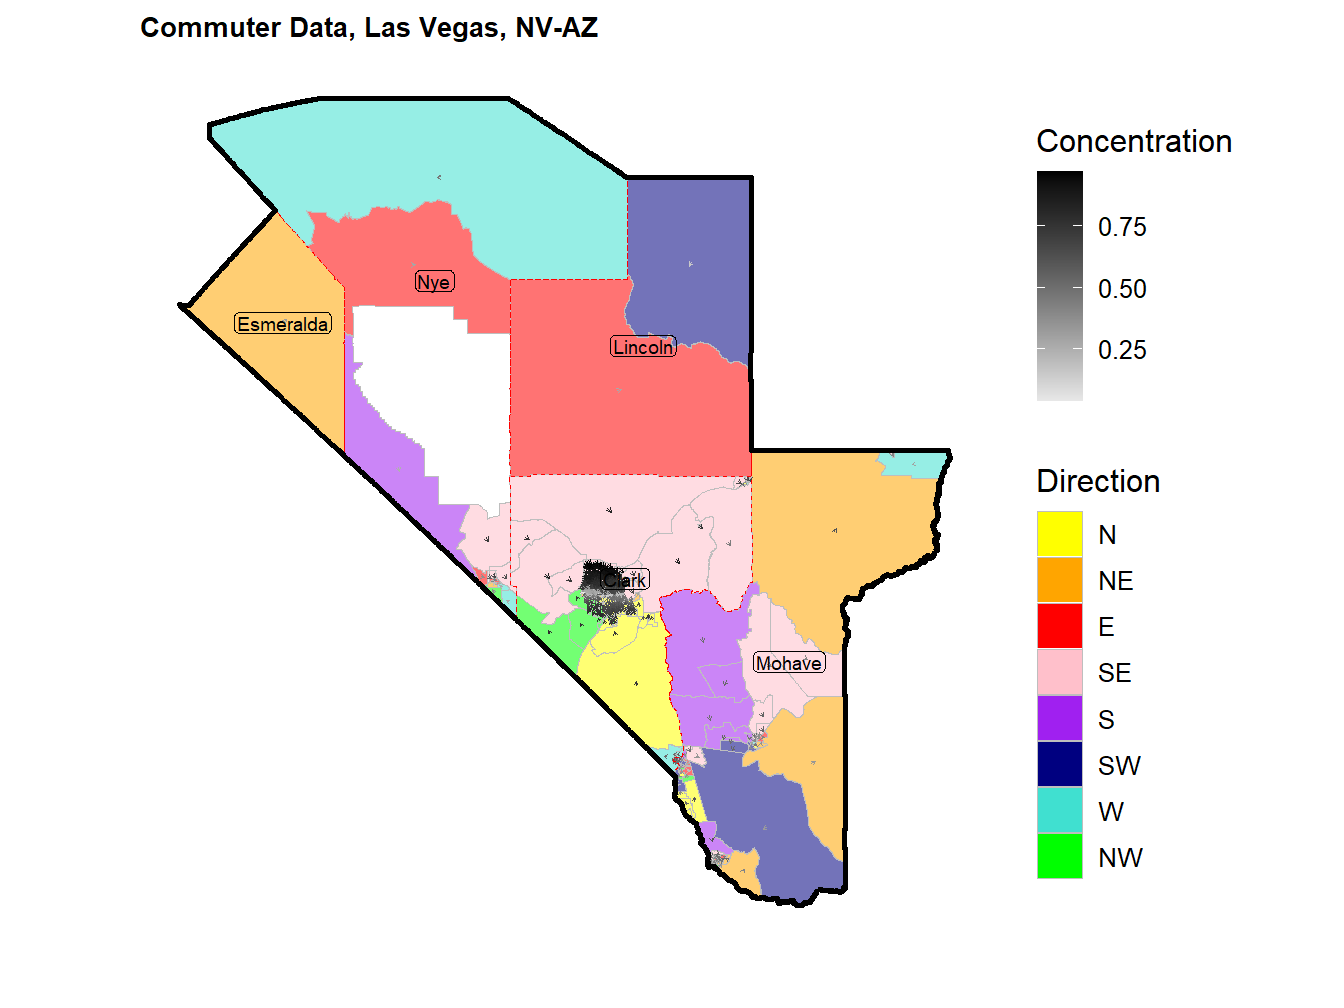
Figure 22: Commute Pattern