Housing
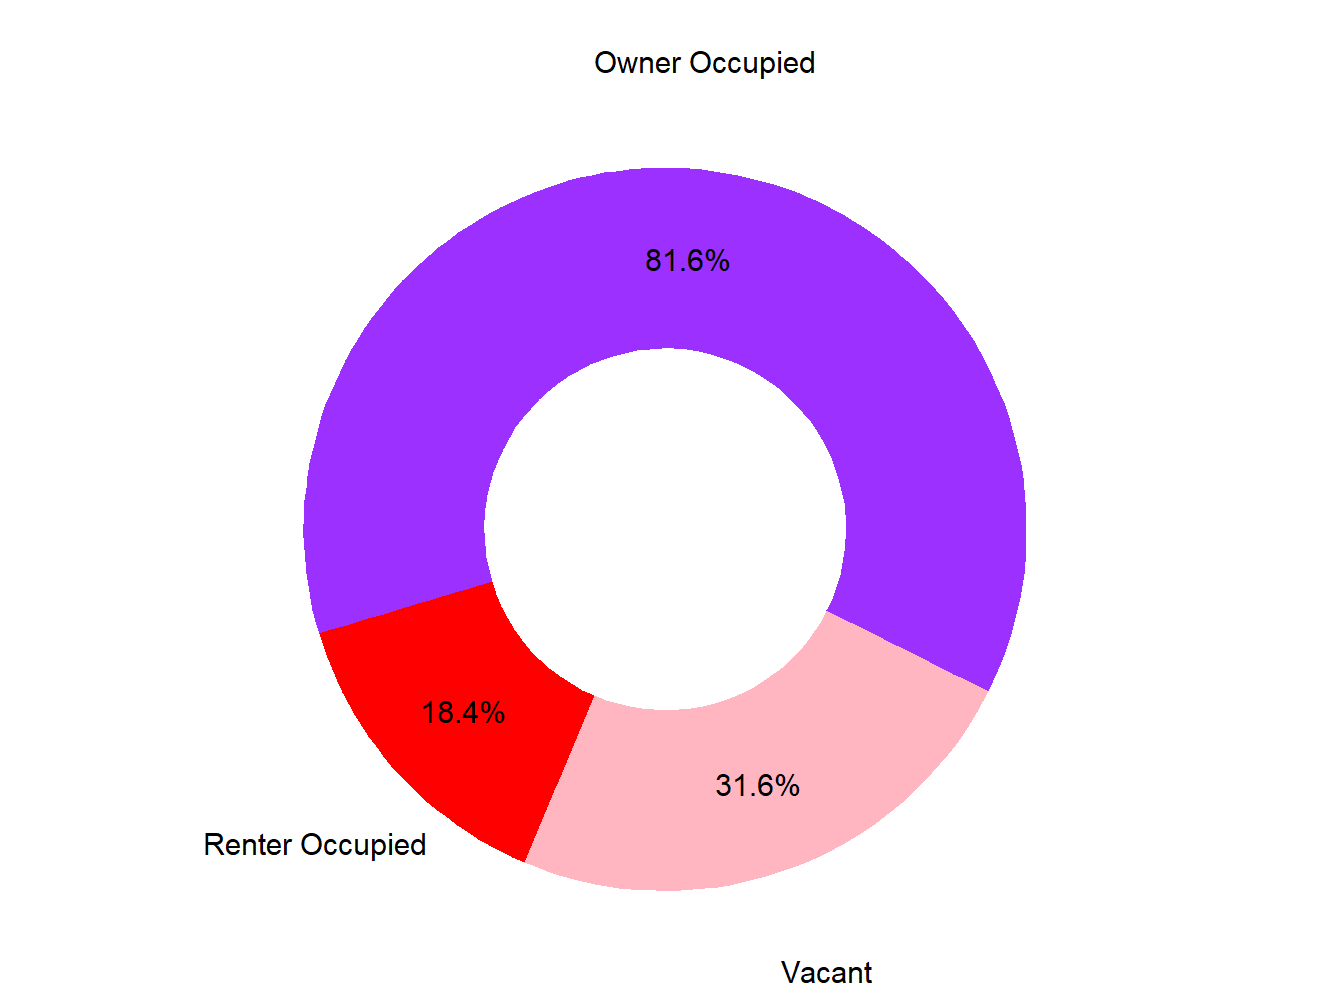
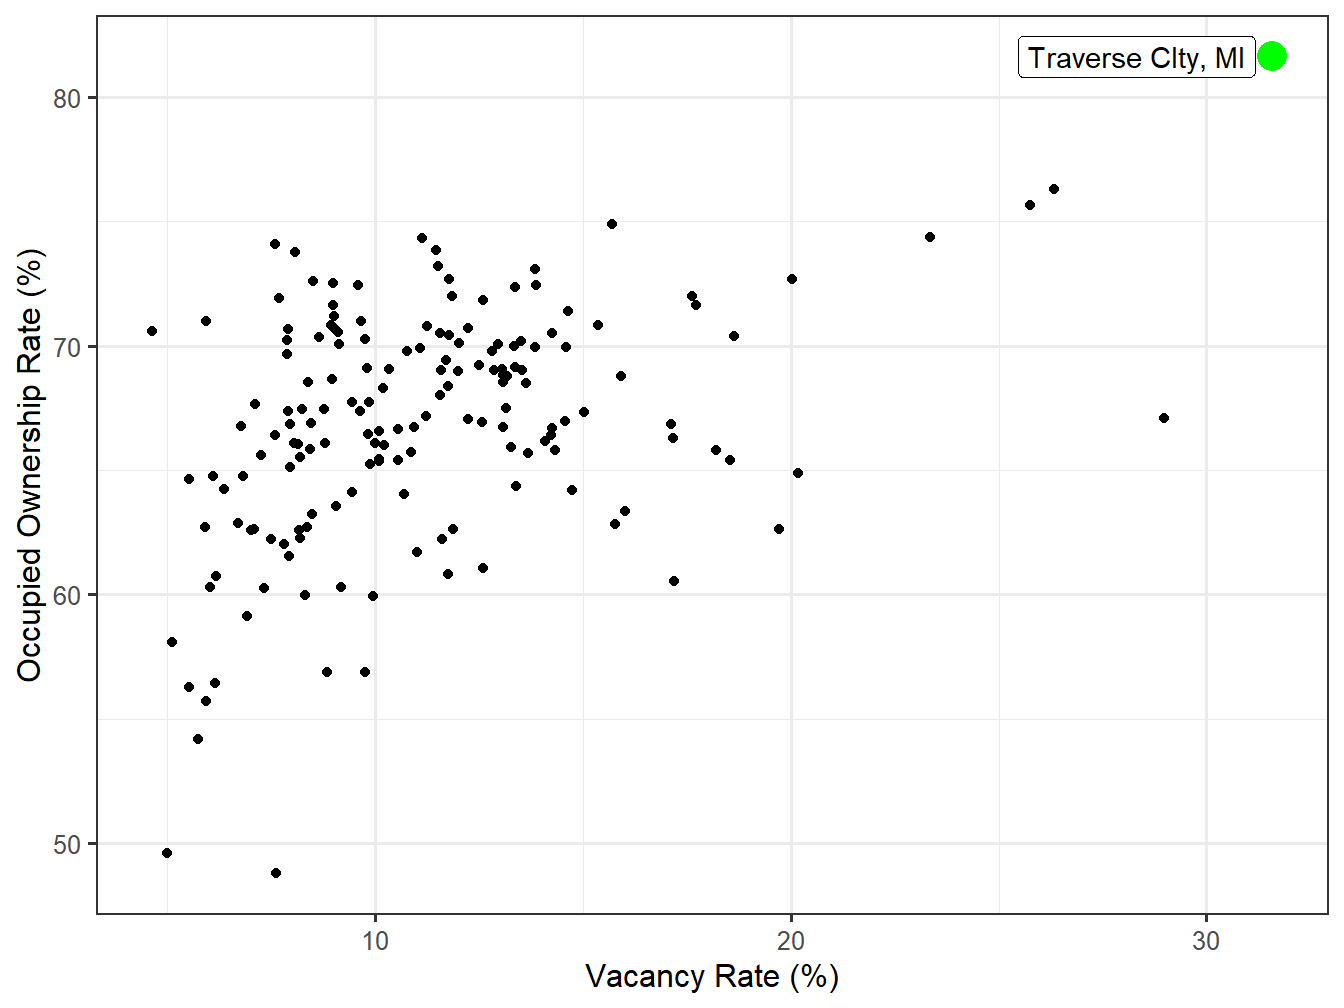
Vacancy - 31.6%
The Traverse CIty, MI Market ranks 1st in Vacancy across STI Markets with a Vacancy rate of 31.6%. That is 131,986 Vacant Housing units compared to 286,025 Occupied units.
Average Home Value - $331,456
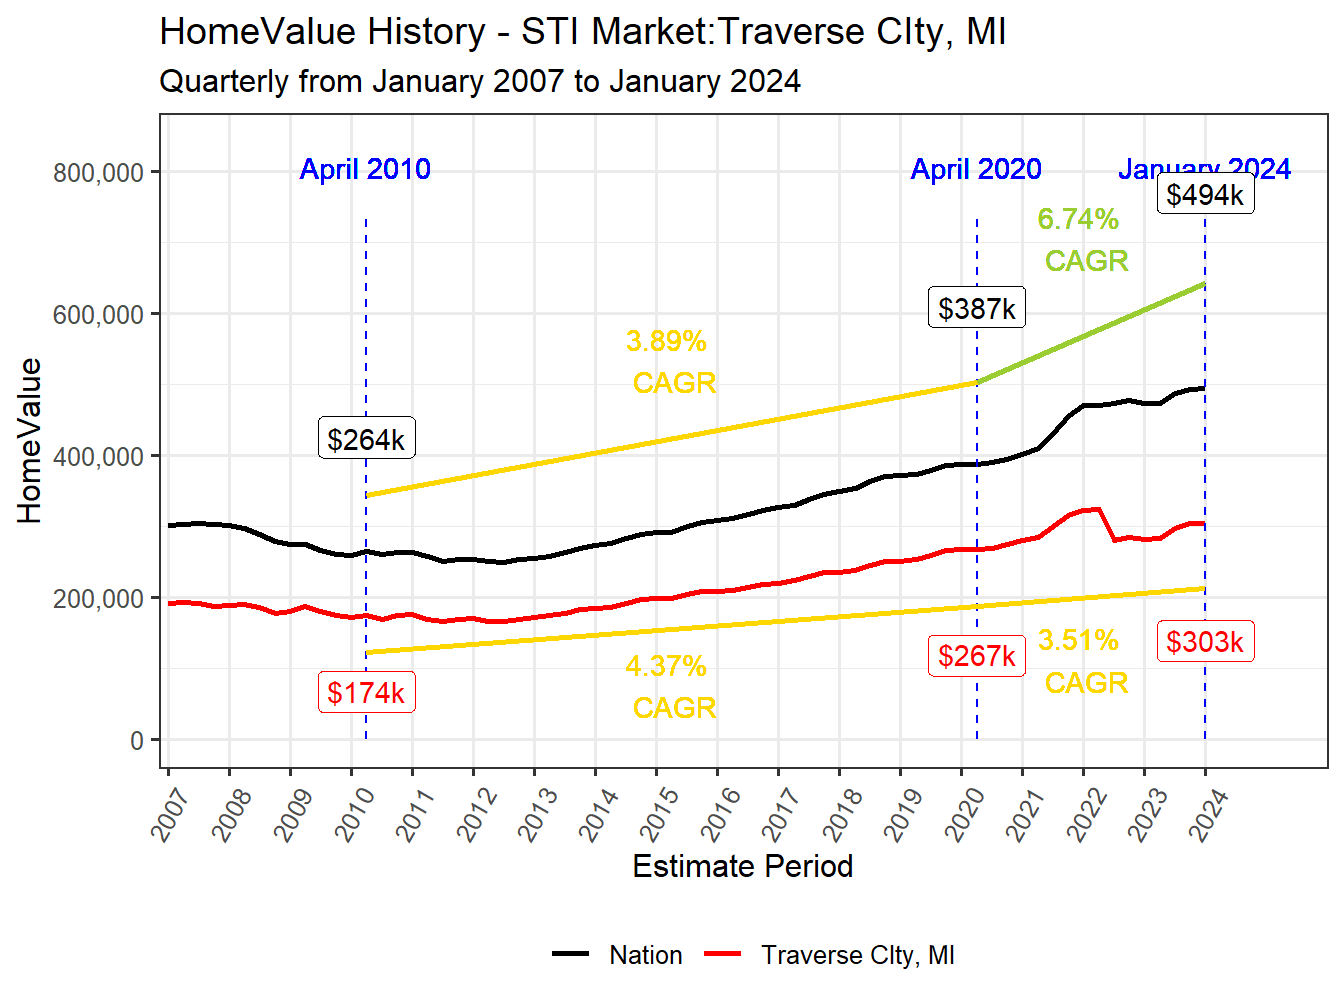
The Average Home Value for owner occupied housing units in the Traverse CIty, MI Market is $331,456. This ranks 101st across STI Markets. Over the last 2 years there has been a change of 15.9% in this markets Average Home Value, compared to a national change of 11.8%. This 2 year change in home values ranks 31st across STI Markets.
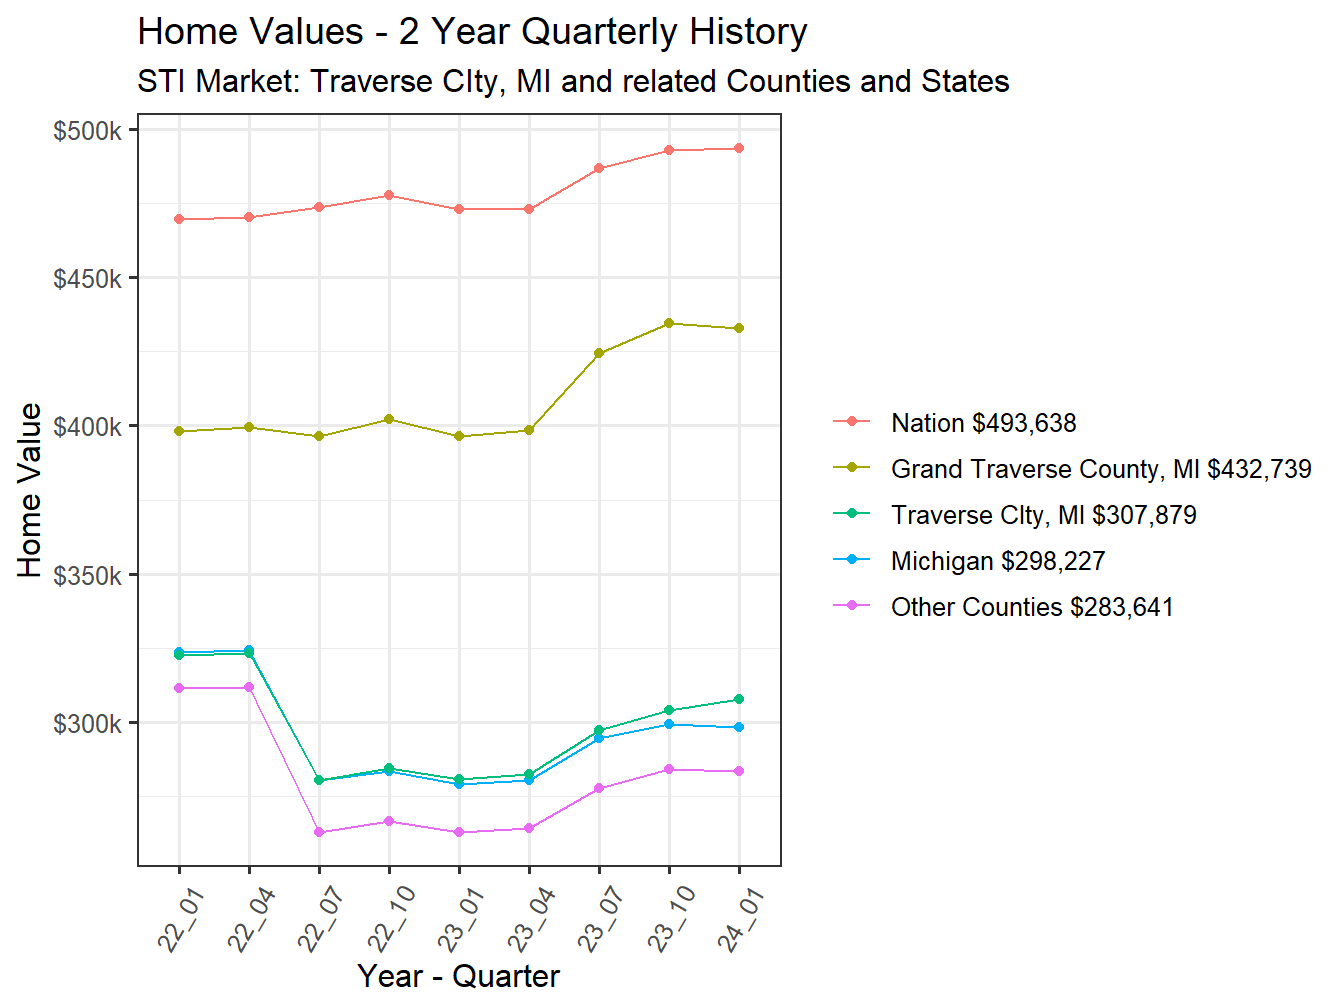
Figure 55: Home Value 2year History
Mortgage Risk Level - Low
Mortgage Risk is defined as the ratio of recent residential loan amount to income for new home purchases. The Mortgage Risk for the Traverse CIty, MI Market is 2.7. The market subsequently ranks 113th across STI Markets. This is considered to be a Low level of mortgage risk.
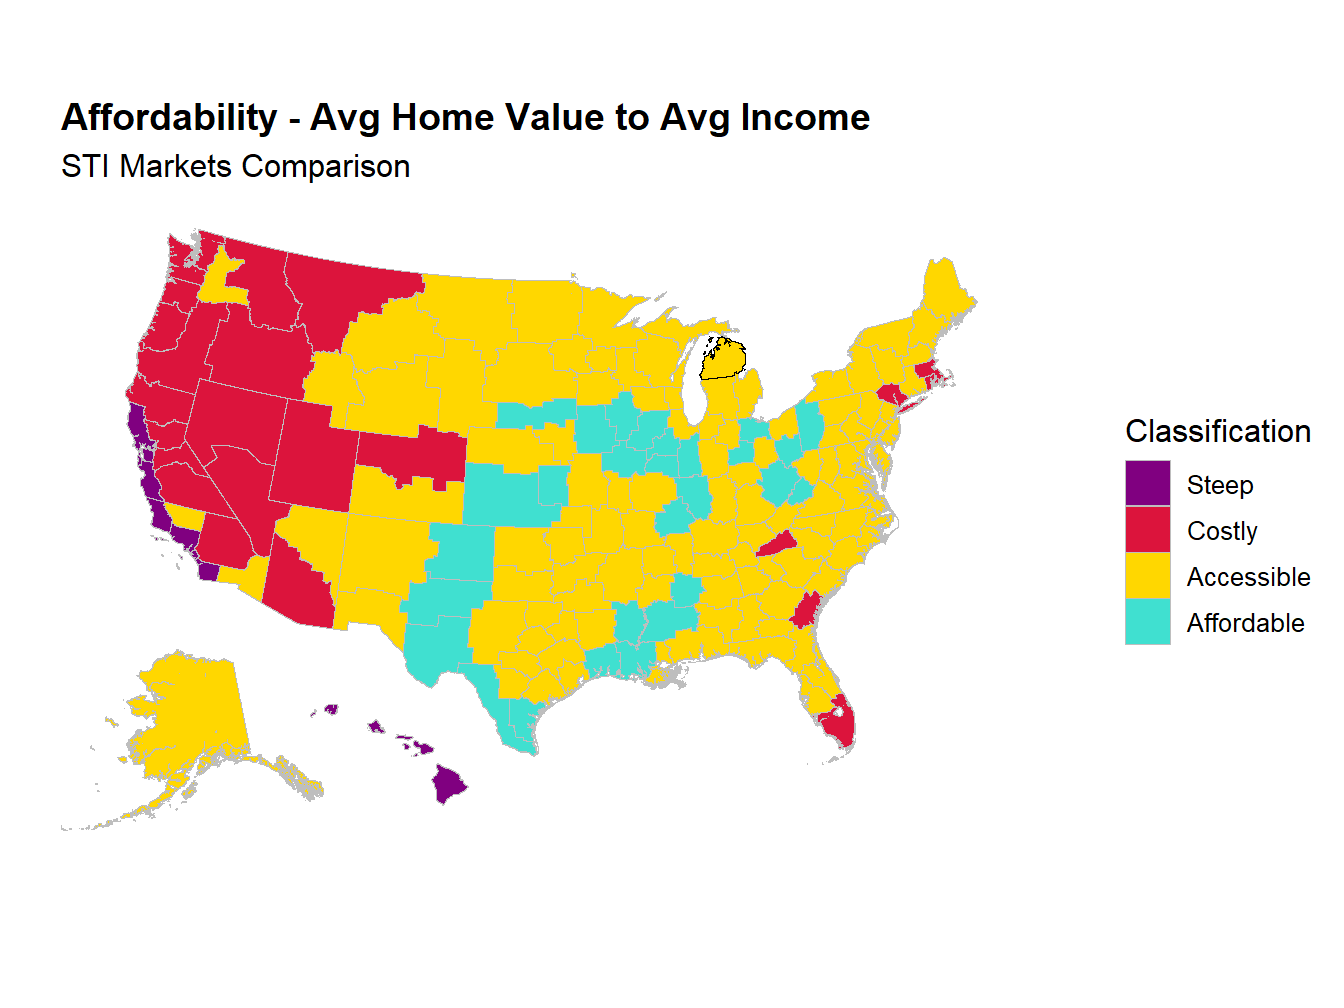
Affordability Level - Accessible
Overall Affordability can be classified in a similar fashion, comparing the Markets Average Home Value with the Average Household Income. This Affordability ratio currently sits at 3.5. The Traverse CIty, MI Market therefore earns the Accessible classification for housing affordability and ranks 81st across STI Markets. The following chart shows how markets compare between these two measure. Note the breaks between affordability classifications are 3, 5, and 7.
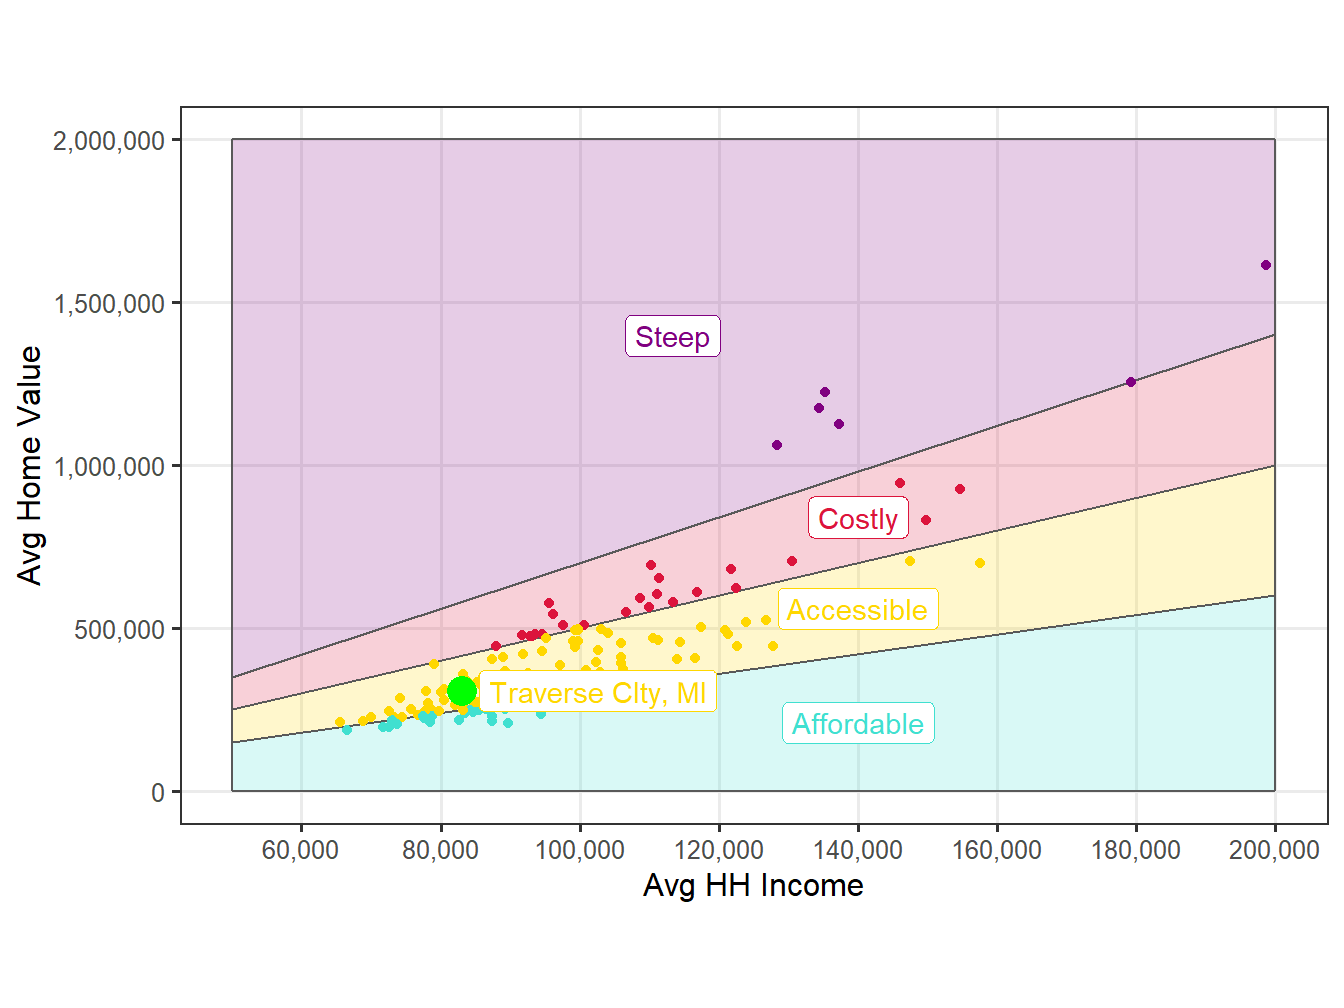
Figure 60: Affordability Comparision