Culture
Cultural identity of an area is often the product of the population’s Ethnicity, Ancestry, Language, and Religious Beliefs. This report will cover these areas for the Traverse CIty, MI Market.
Ethnicity
Racial groups in the US often include White, Black, Asian, and Other. In a similar context whether or not a person is of Hispanic origin is also typically a defining characteristic of ethnic identity. The following reports look at 5 ethnic categories, Hispanic, and non-Hispanic: White, Black, Asian, and Other.
Largest Ethnicity - White
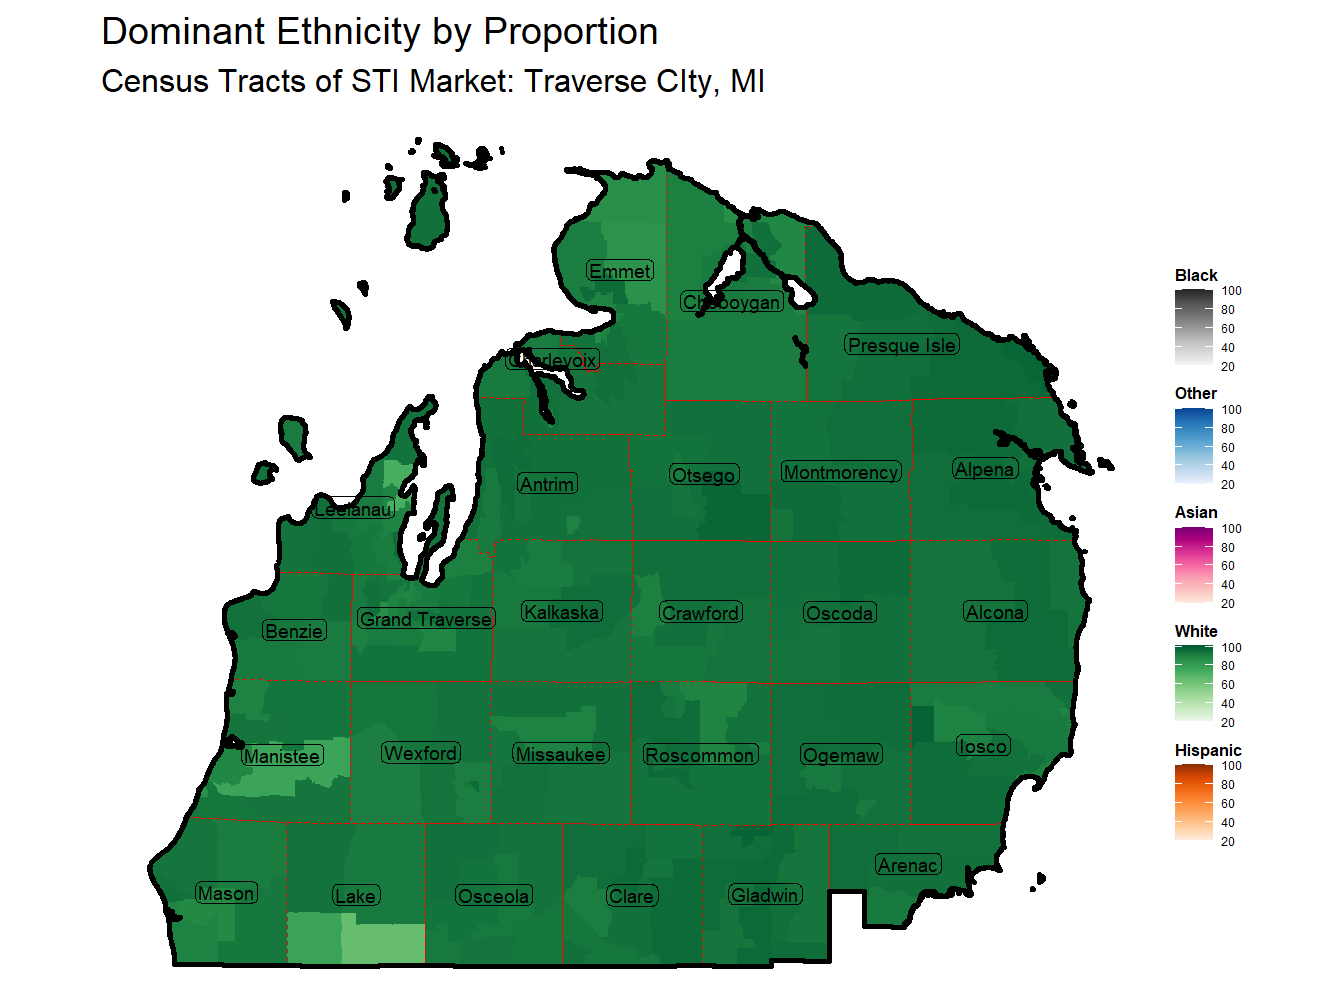
The White Ethnicity makes up the largest share of the Population in the Traverse CIty, MI Market at 91.3%. This is yields a location quotient of 1.57 time the national average. Subsequently the Traverse CIty, MI Market ranks 4th in the proportion of White Population across STI Markets.
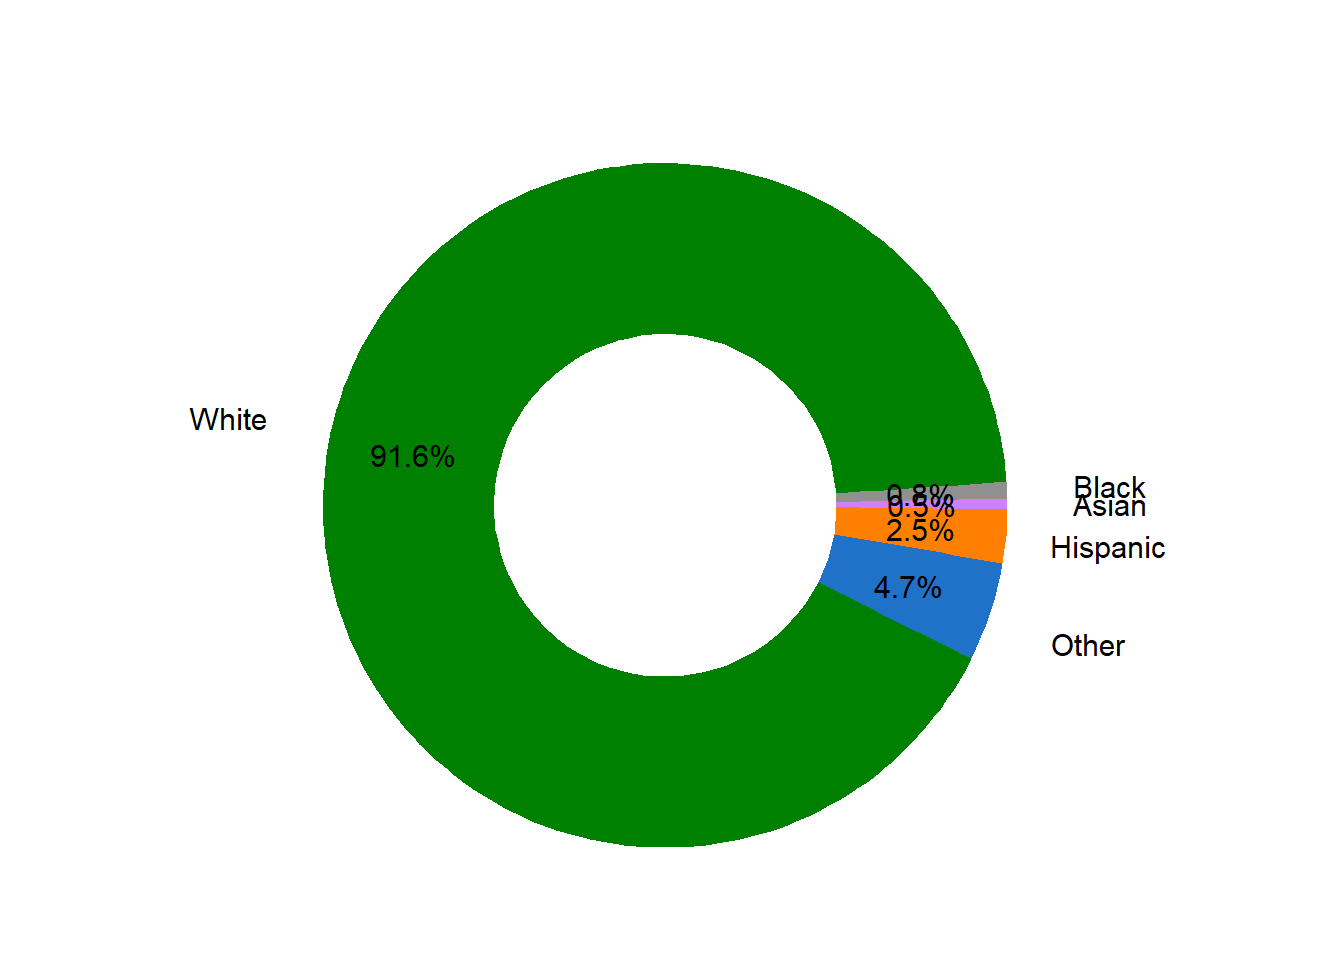
Figure 11: Ethnicity Proportion in Market
Notable Ethnicity - White
The proportion of White Population in the Traverse CIty, MI Market is notable. This ethnicity comprises 91.3% of the market’s population, yielding a location quotient of 1.57 time the national average. Subsequently the Traverse CIty, MI Market ranks 4th in the proportion of White Population across STI Markets.
Ancestry
Ancestral origin across the US is quite varied with small communities existing from most parts of the world. Many of the smaller Ancestry groups are combined to “other” categories from the predominate larger ancestral region. Unclassified amount is also high among those that don’t know or give their ancestry or give a response that is uncommon. These categories will be excluded from the following reports and include the Other Hispanic, Other Asian, Other European, Other, and Unclassified Ancestries.
Largest Ancestries - German, Scotch Irish, and British
Large ancestries in the Traverse CIty, MI Market include German, Scotch Irish, and British . These ancestries make up 16.3%, 9.4%, and 9.2% of the total population, respectively. When comparing to national proportions, the German ancestry is the most notable with a location quotient of 2.26 the proportion of this ancestry ranks 32nd across STI Markets.
Sub-Market Ancestry Dispersion
Looking at those 3 Ancestries, which are most prevalent across the market.
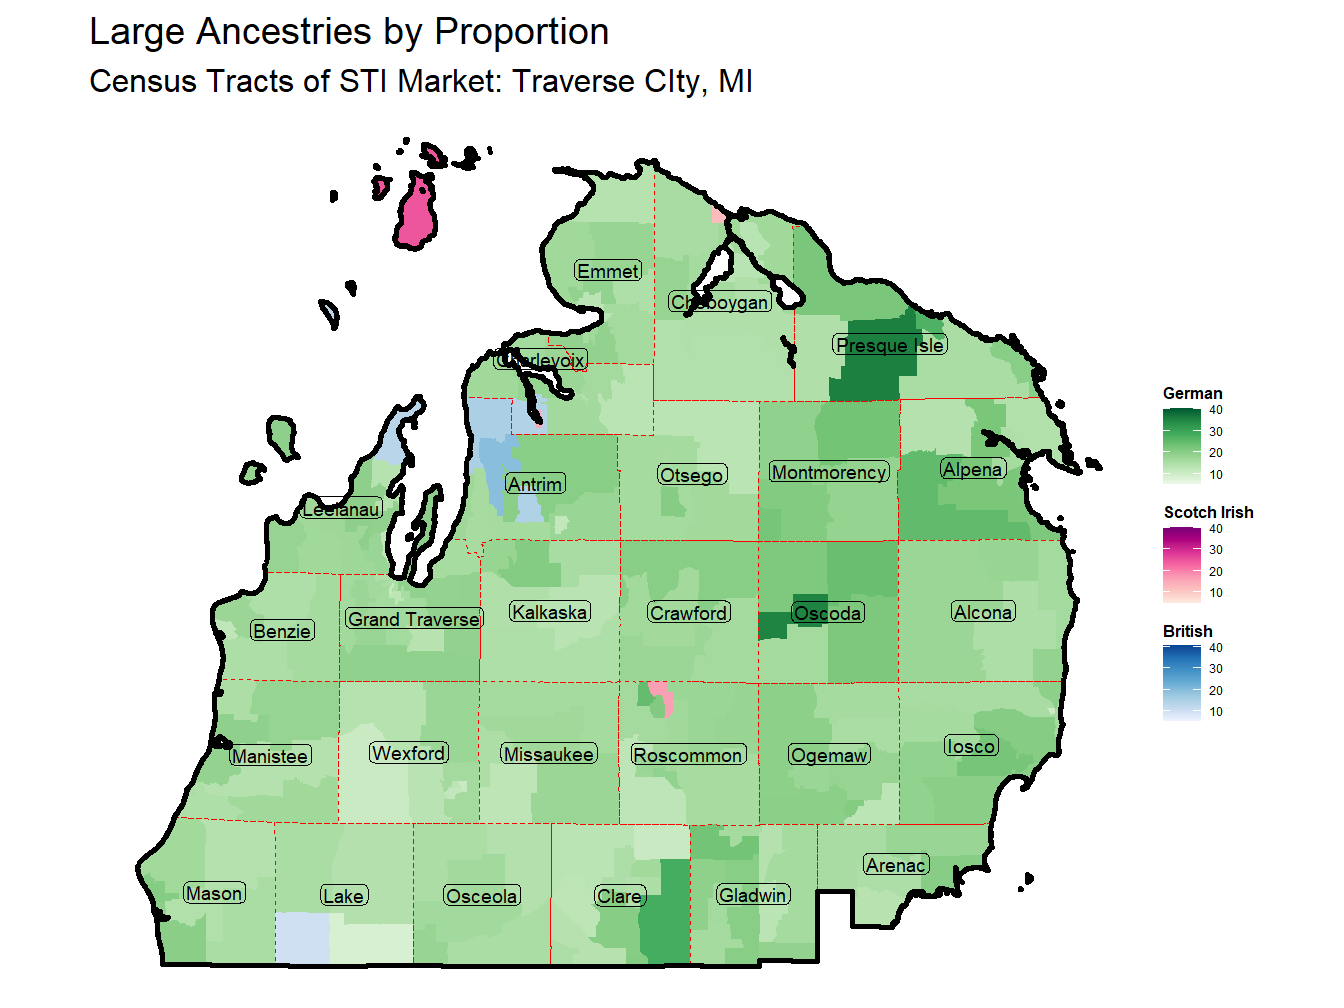
Figure 13: Ancestry Thematic
Other Notable Ancestries - Dutch, Polish, and Canadian
The Traverse CIty, MI Market is also home to a larger than average share of people with Dutch, Polish, and Canadian Ancestries. These ancestries account for 2.3%, 6.1%, and 1.7% of the population, respectively. With location quotient of 4.6, 4.36, and 4.25 the Dutch, Polish, and Canadian Ancestries rank 5th, 1st, and 10th across STI Markets, respectively.
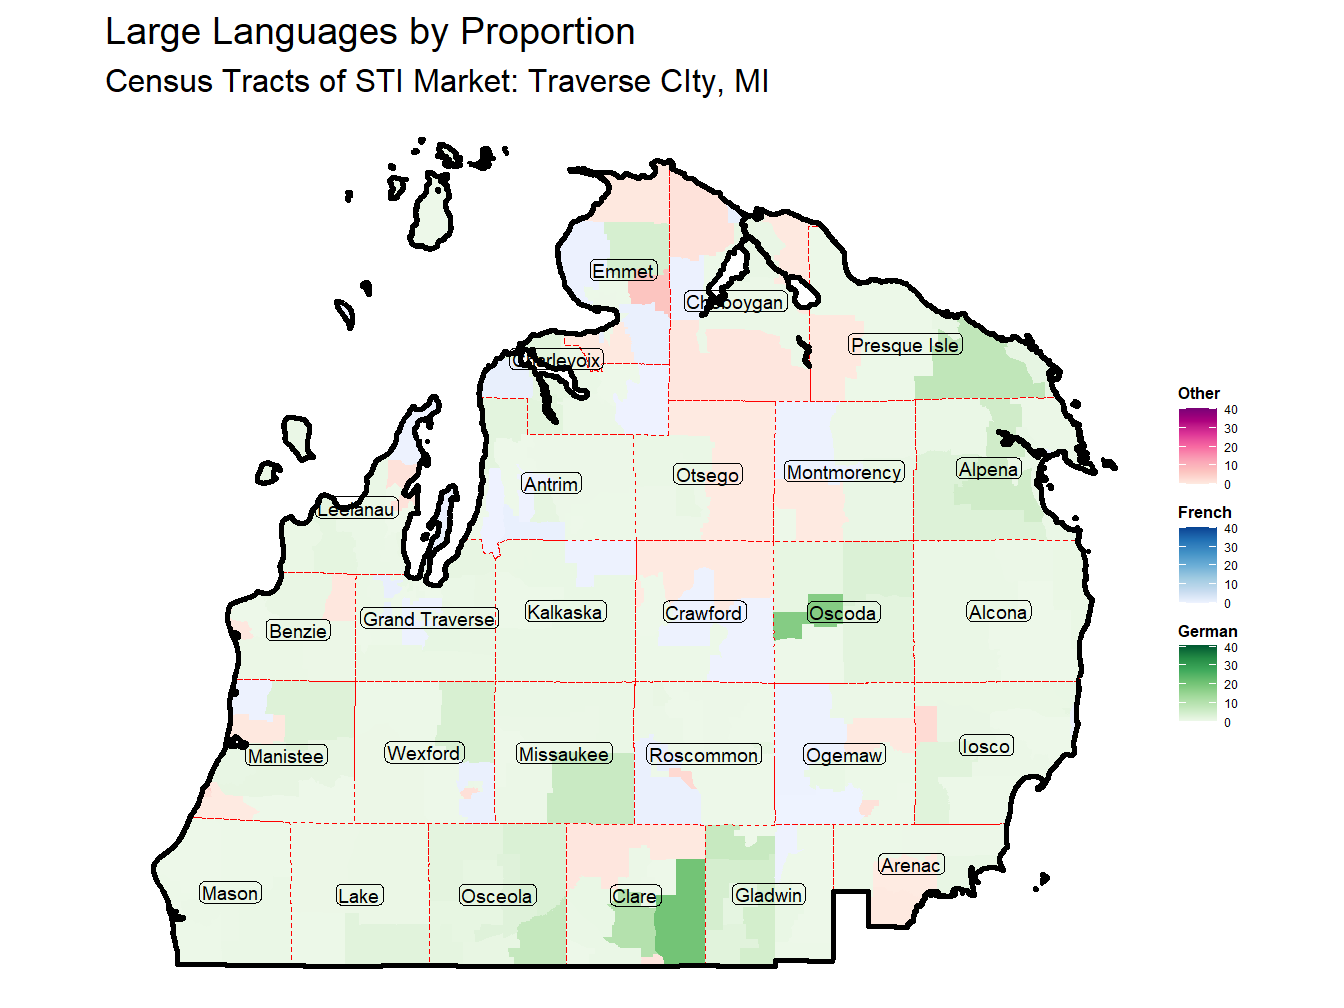
Language
English is the predominate language across the US. There are however a number of other languages spoken depending on the market. Languages considered in this report include the Spanish, French, German, Slavic, Other Indo Euro, Chinese, Korean, Vietnamese, Other Asian, Tagalog, Arabic, and Other languages. The following is a look at the degree and dispersion of Non-English languages and language groups spoken in the Traverse CIty, MI market.
Non-English Languages - Spanish, German, and French
The most widely spoken Non-English Languages in the Traverse CIty, MI Market include Spanish, German, and French . These languages make up 1.1%, 1%, and 0.2% of the over 5 population, respectively. When comparing to national proportions, the German language is the most notable with a location quotient of 2 the proportion of this language ranks 11th across STI Markets.
Religion
57% of the population in the Traverse CIty, MI Market is of unknown religious affiliation. This category is generally made up of those that are not religiously affiliated, though a small fraction may represent dharmic religions. This level of unknown religious affiliation ranks 34th across STI Markets. The following looks at the remaining 43% of the population that are affiliated.
It should also be noted that nationally approximately half of the religiously affiliated population would be considered Christian Protestant. This classification however encompasses many denominations with various beliefs and practices. We have subsequently grouped these church congregations by denomination and by a classification of Mainline and Evangelical disposition. You will see these groups described with ML and E respectively where a breakout by denomination is given and in other cases they are listed in total as simply Mainline or Evangelical.
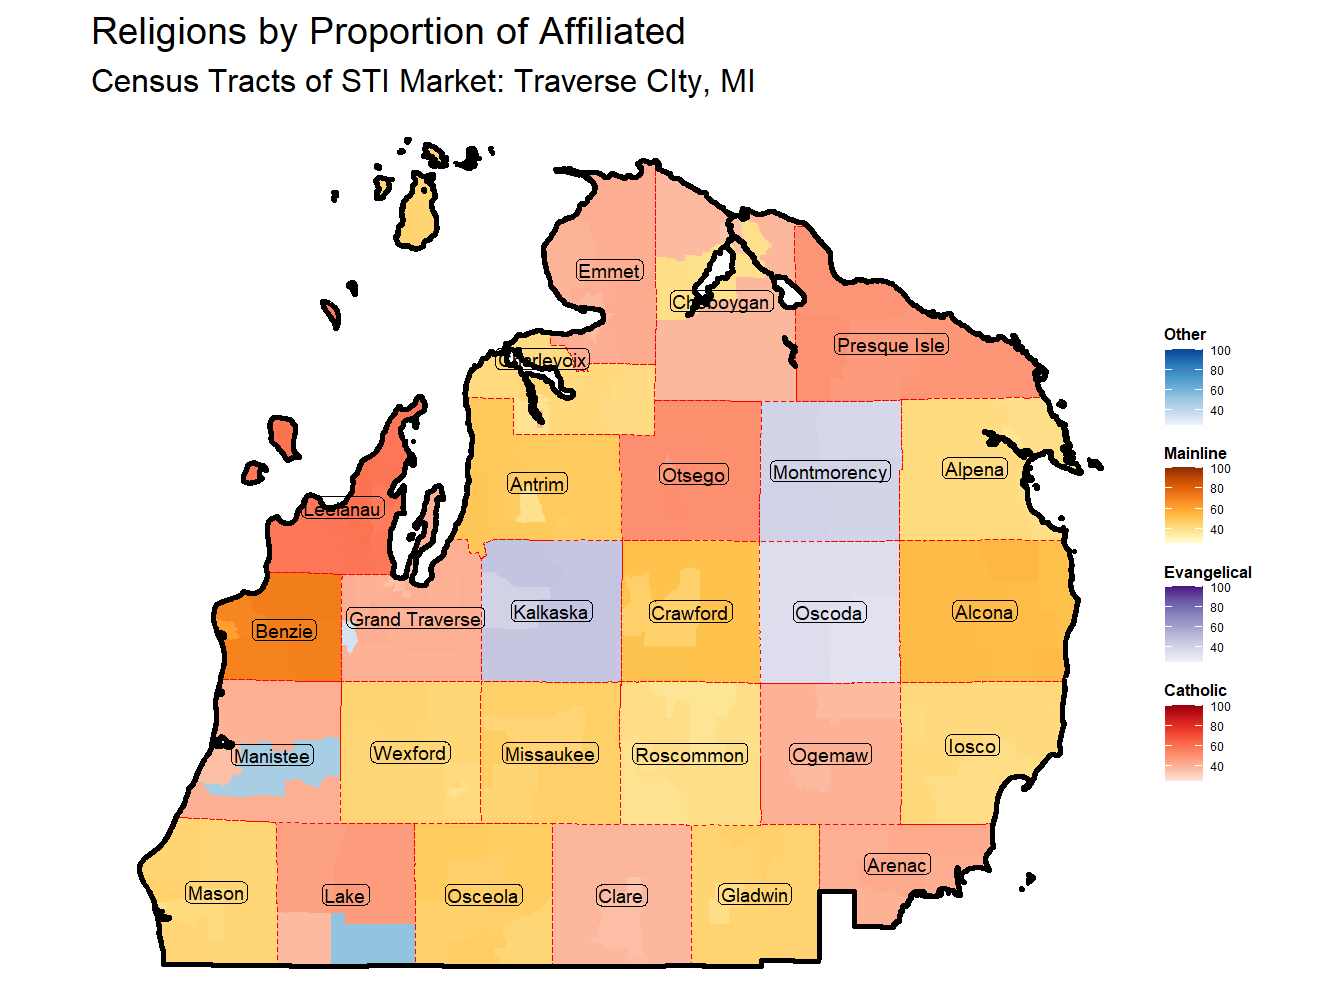
Laregest Religions - Mainline, Catholic, and Evangelical
The 3 largest main religions in the Traverse CIty, MI Market are Mainline, Catholic, and Evangelical . These religions make up 37.7%, 35.1%, and 23.9% of the affiliated population, respectively. When comparing to national proportions, the Mainline religion is the most notable with a location quotient of 1.53 the proportion of this religion ranks 48th across STI Markets.
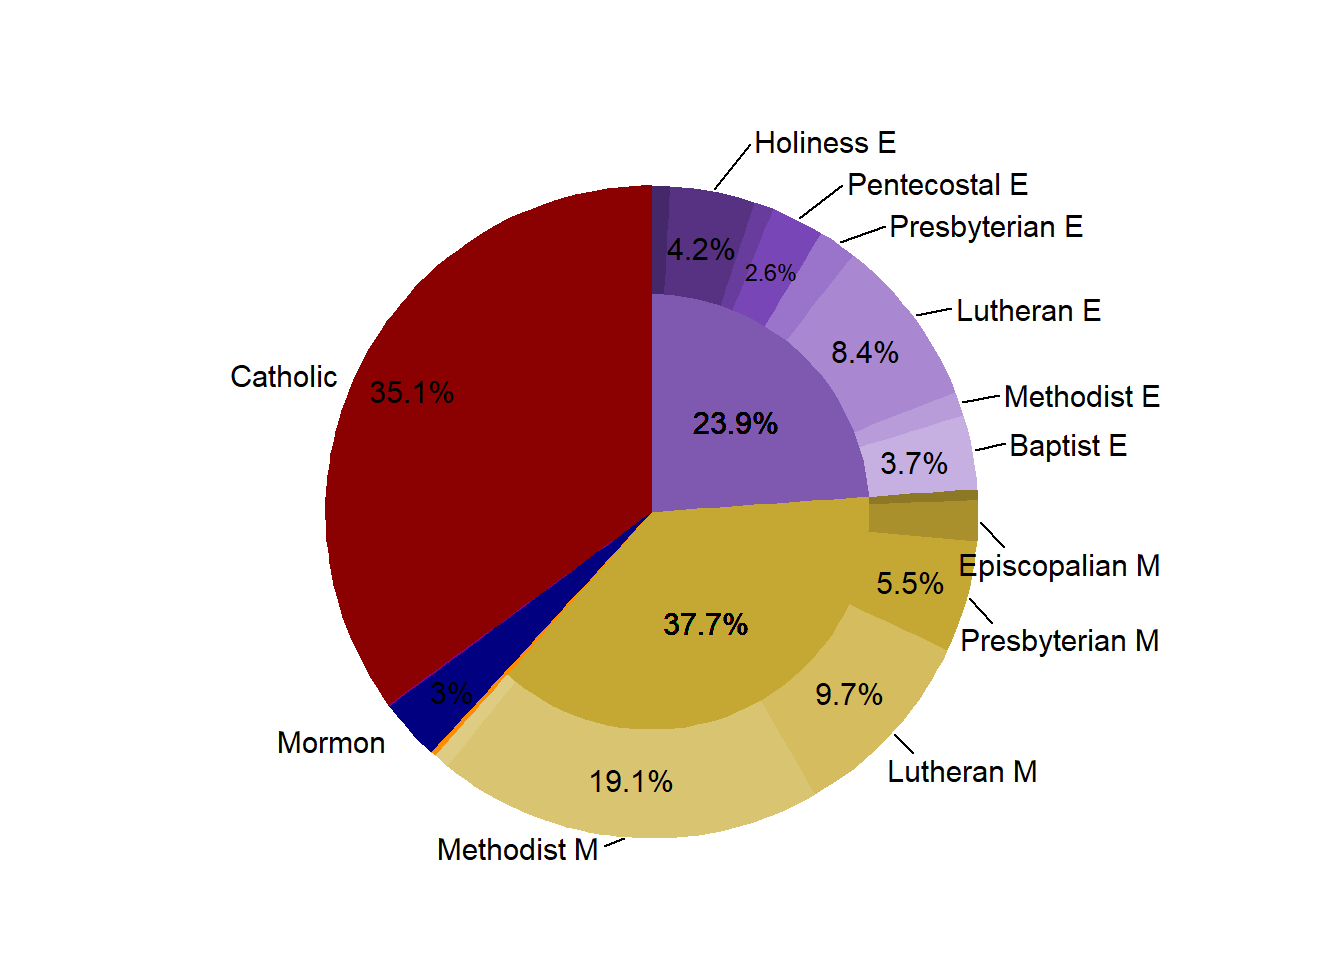
Figure 15: Religous Proportion in the Market