Age and Family Structure
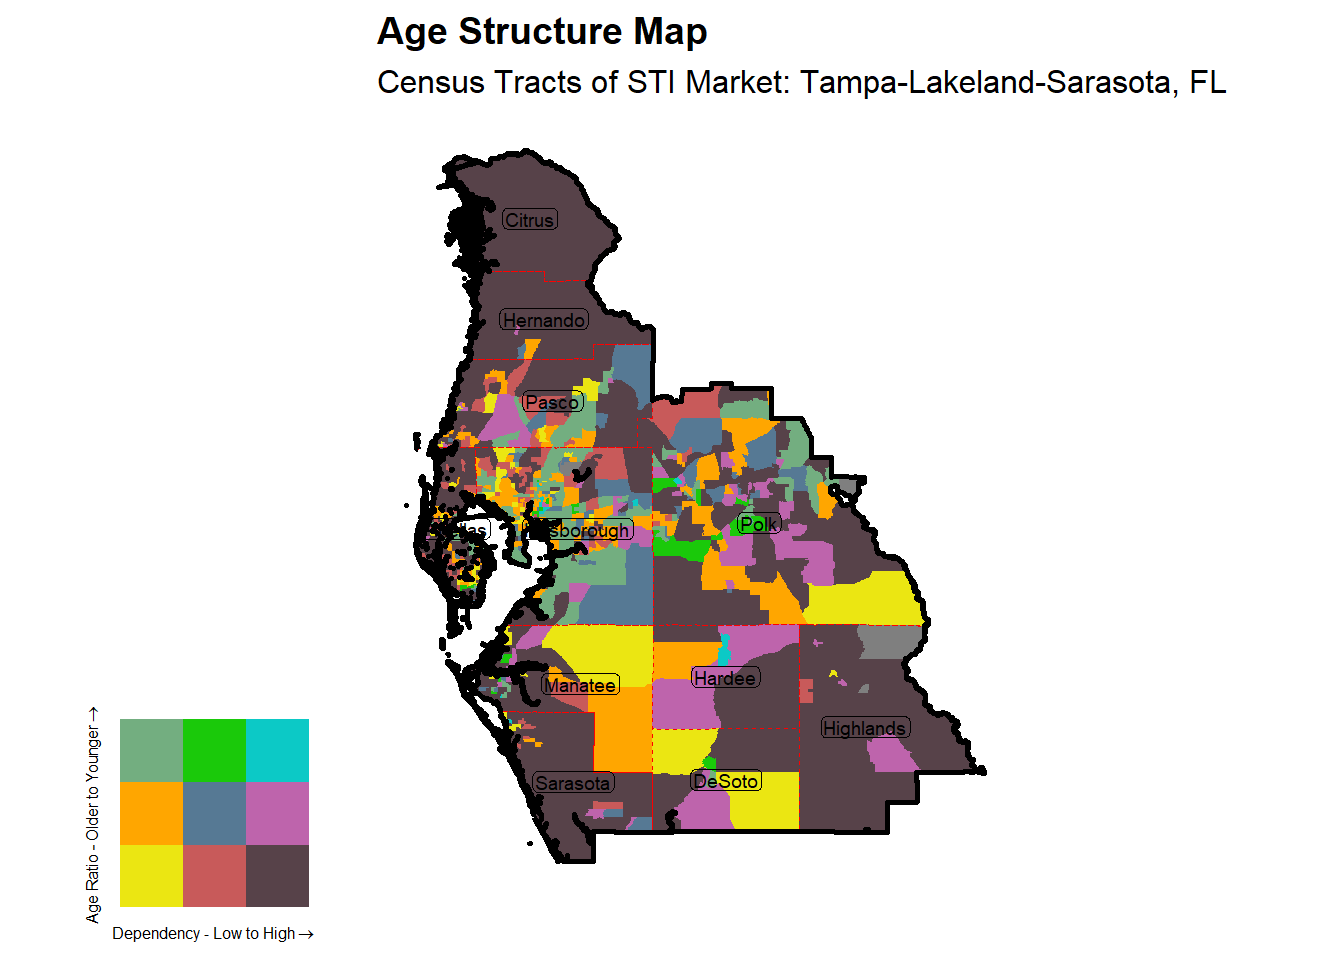
This report looks at the Age distribution of the Tampa-Lakeland-Sarasota, FL and quantifies the structure in to 9 possible categories. These are based on 2 scales, Dependency and Age Proportion Ratio of the Dependency. Dependency here is the ratio of dependent population, include older dependents over 65 and younger dependents under 15 compared to the 15 to 65 working age population. This measure is often used a way of quantify the amount of strain that the working age population might have in supporting those not working and is sometimes further refined to focus on only those currently working. In this case however we focus only on the age structure. The percentage that the young make up of the dependent population yields the Dependent Age Proportion, with a higher value indicating a younger population.
Market Age Structure Classification: Aged
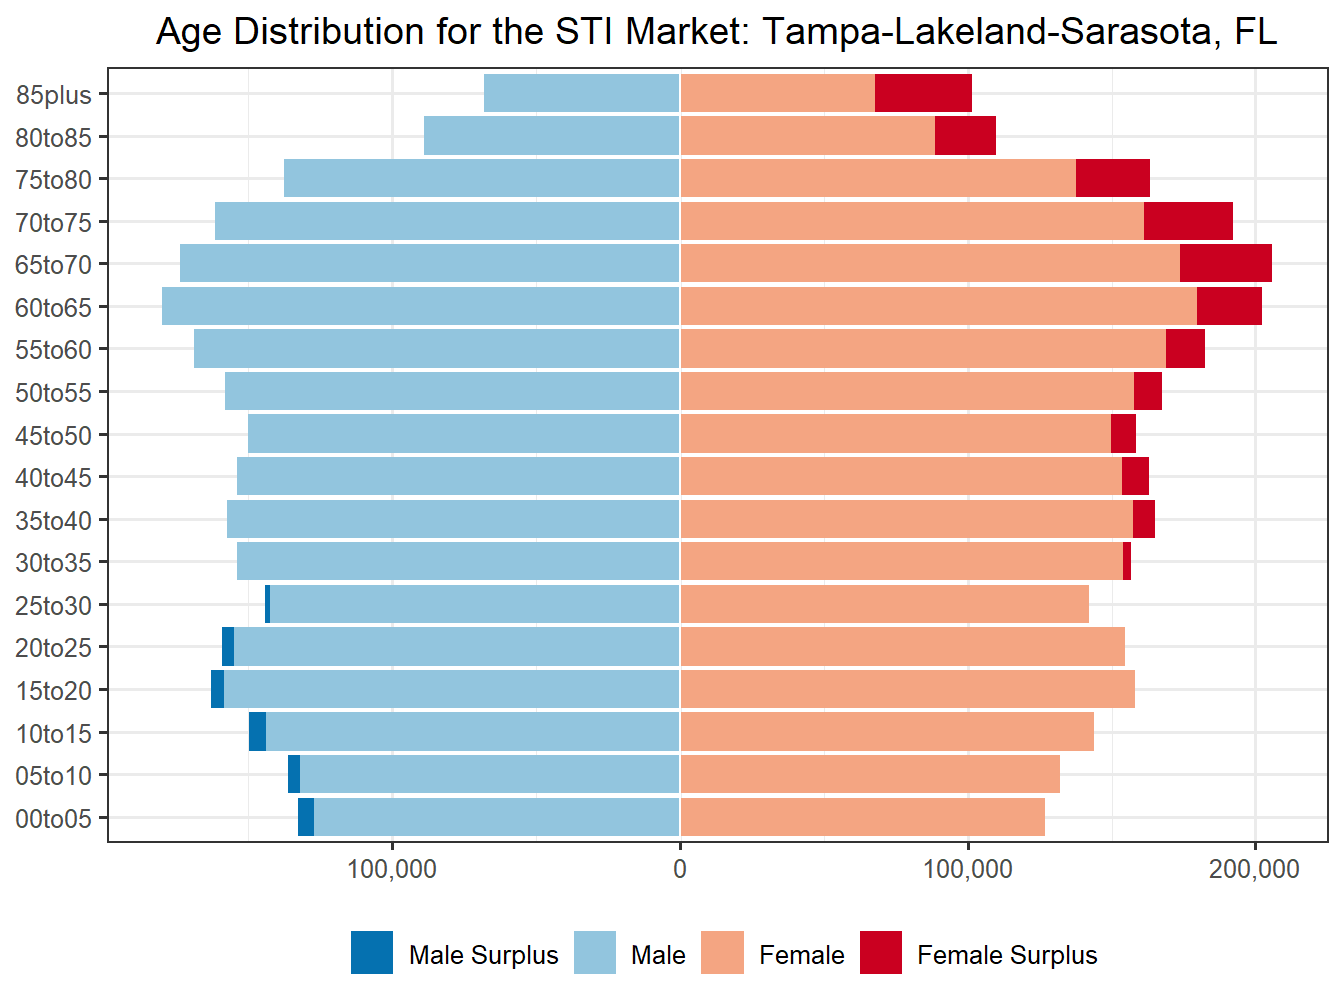
The Tampa-Lakeland-Sarasota, FL market has a dependency ratio of 69.3 which is considered a High level of dependency. The proportion of that dependent population that is under 15 is 36% and subsequently this market could be age wise considered Elderly. These two classifications in mind the Tampa-Lakeland-Sarasota, FL market falls in the Aged Age Structure Classification.
With a High level of dependency and that dependency skewing older, markets with this structure are likely to decline unless continually re-inforced with in migration. Markets of this structure may be fairing well if they are receiving this in migration. Markets that are not are likely declining in Population and potentially suffering economically. Being dependent on a Retiring in migration can be potentially unstable. It is likely too late for a higher birth rate to have much of an impact. If in migration of a younger nature begins this market might shift quickly to a more favorable structure. The cost of this would be a rapid change the composition of this market. The future of this market is reliant on the nature and the amount of the in migration, without it this market will contract in population and economic opportunity.
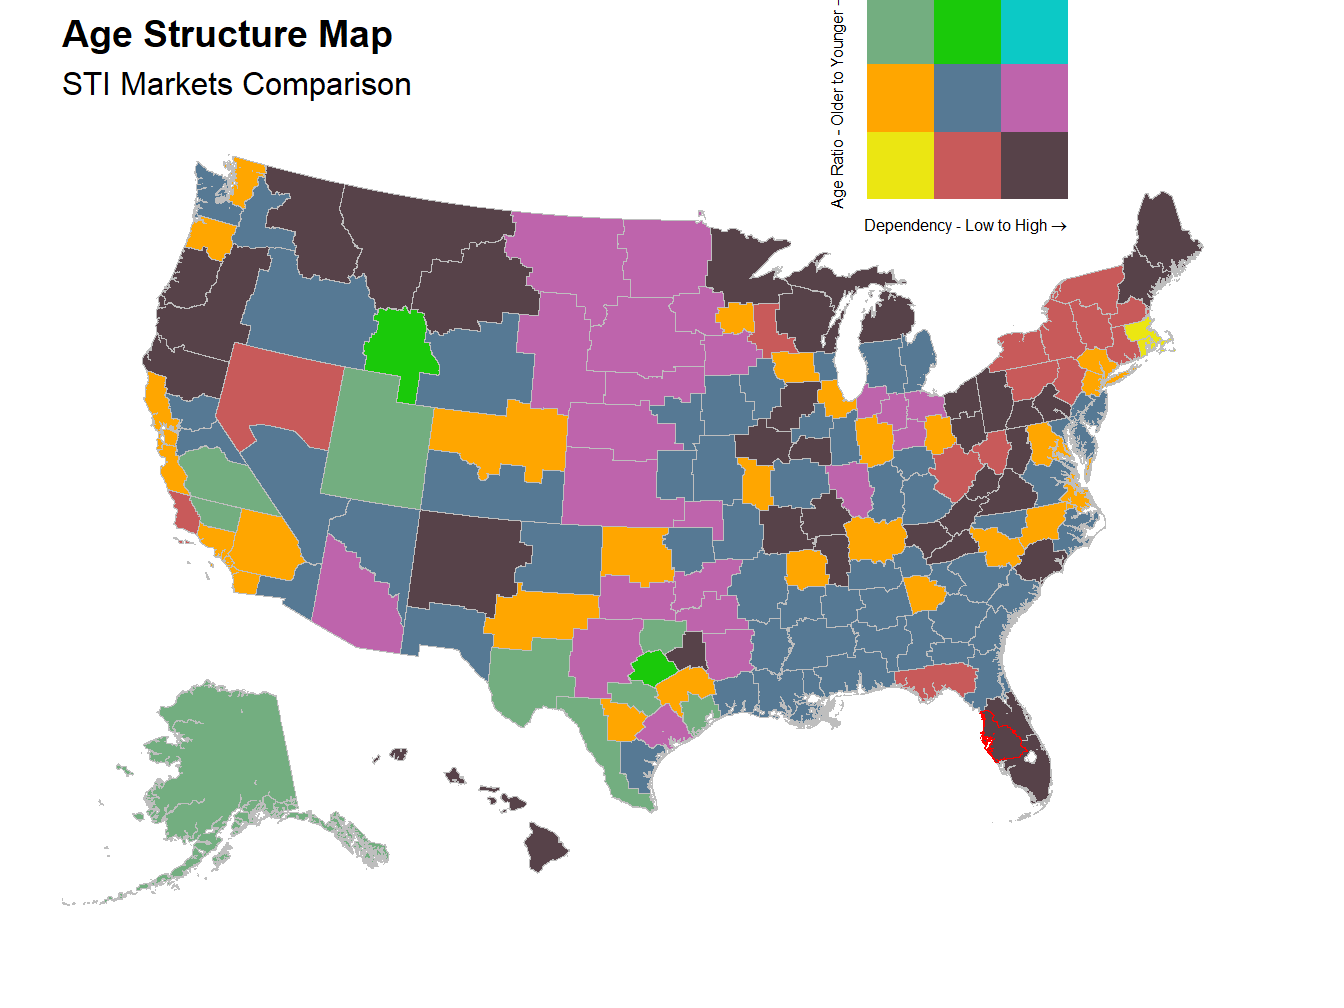
STI Markets Comparison - Age Chart
The lines on the following chart are the break points used for structure classifications. For dependency on the X axis they are 56 and 61. For the age proportion of younger dependents (out of young <15 and old dependents >65) on the Y axis they are at 55% and 45%.
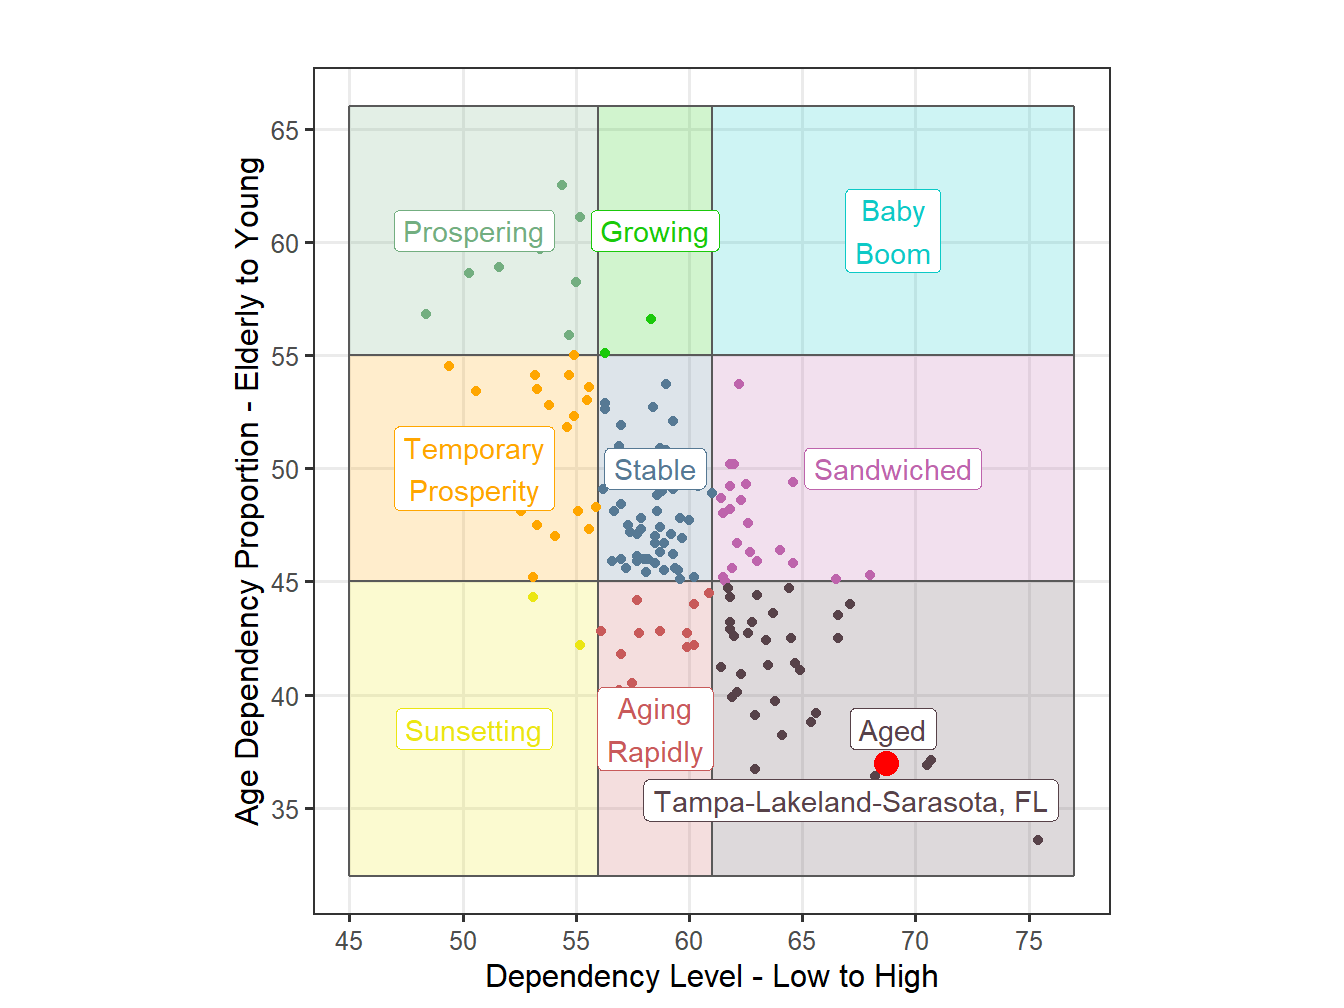
Figure 17: Age Structure Classification for STI Markets