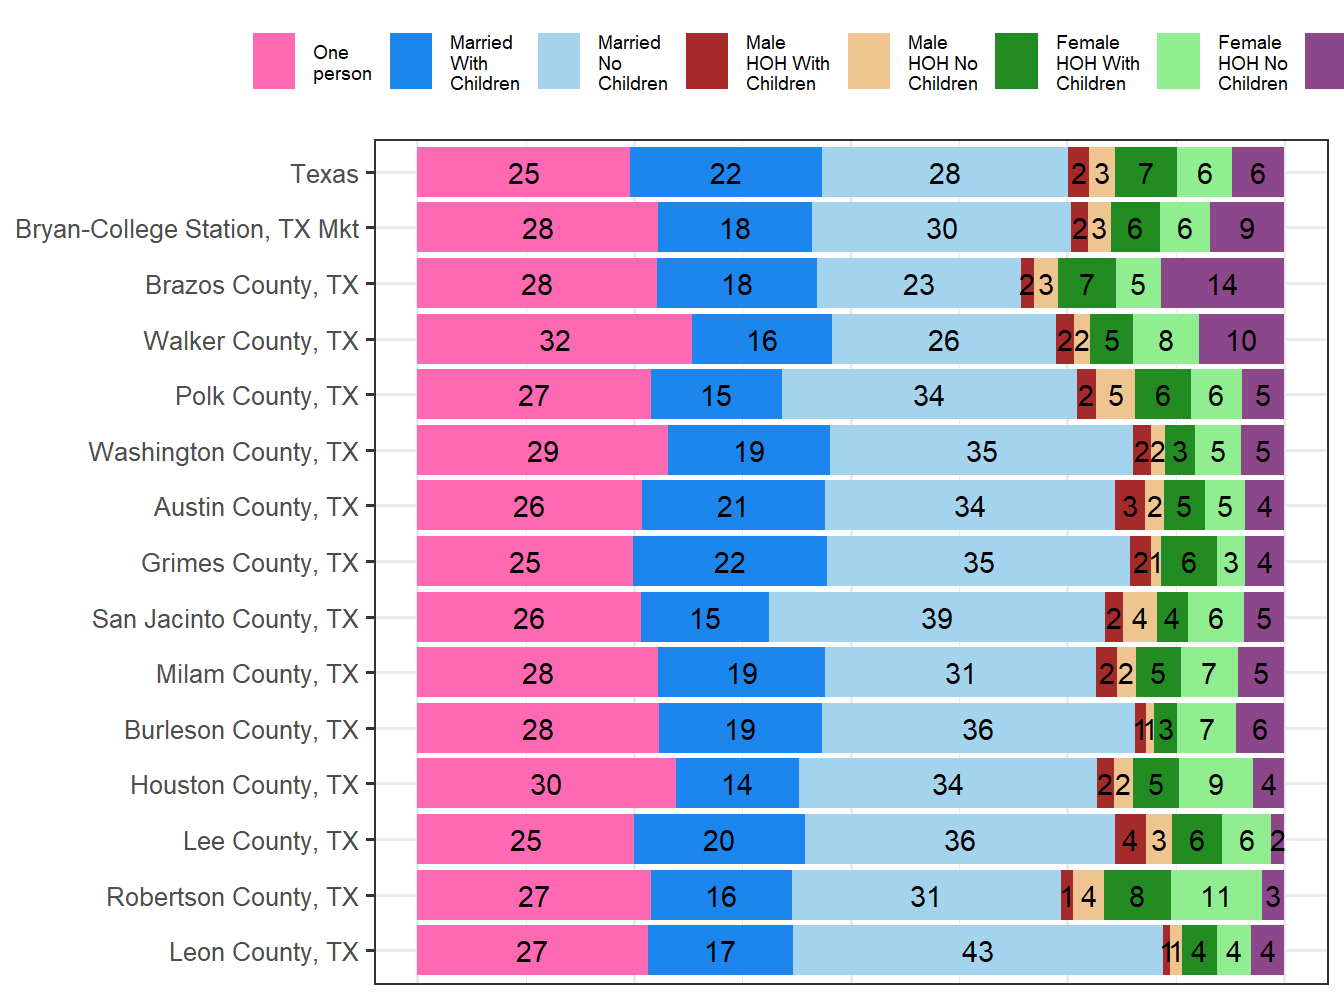
Age and Family Structure
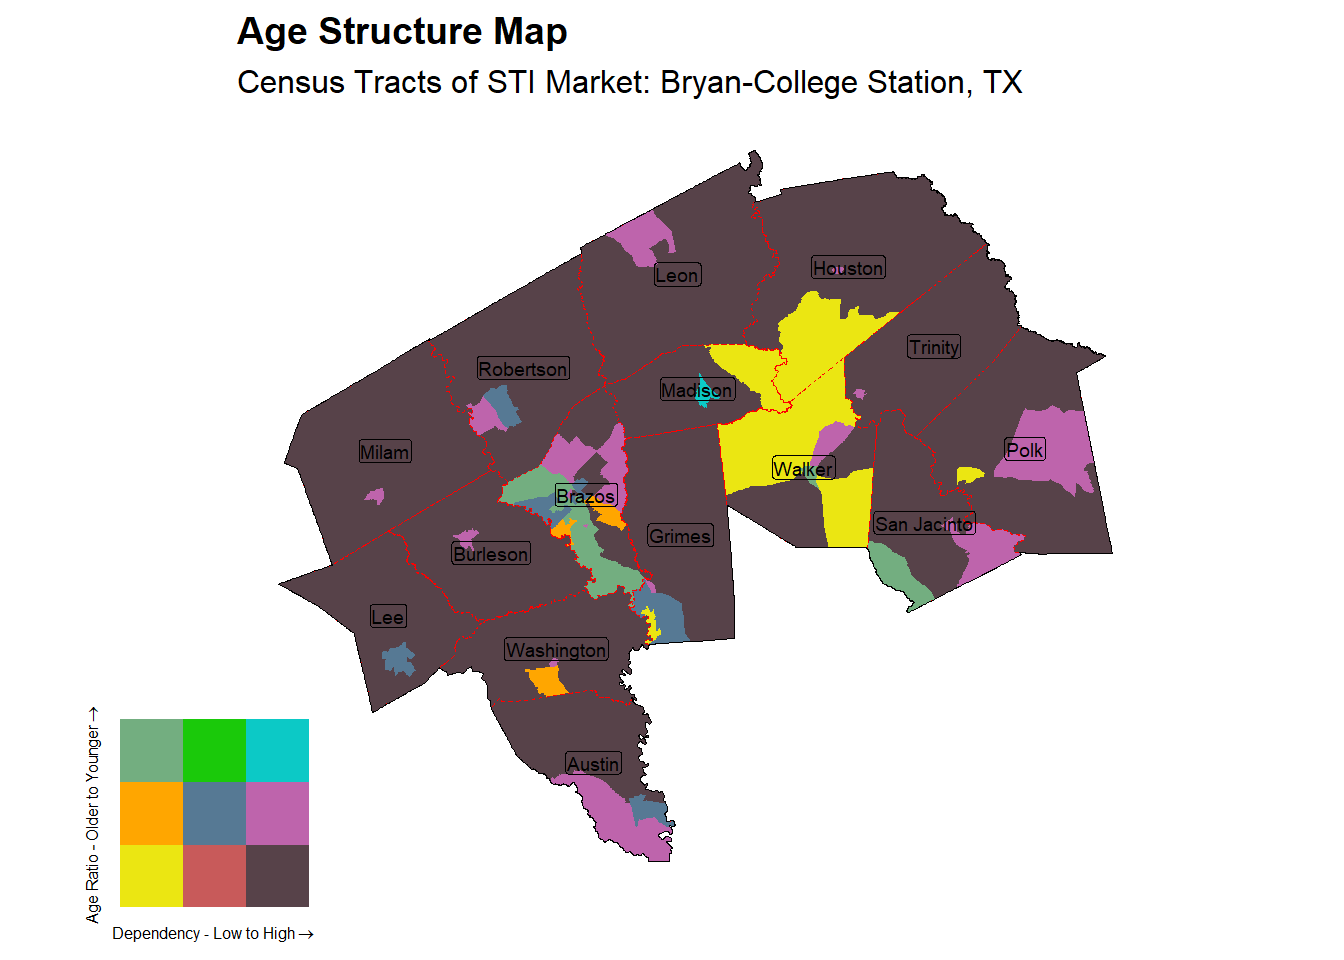
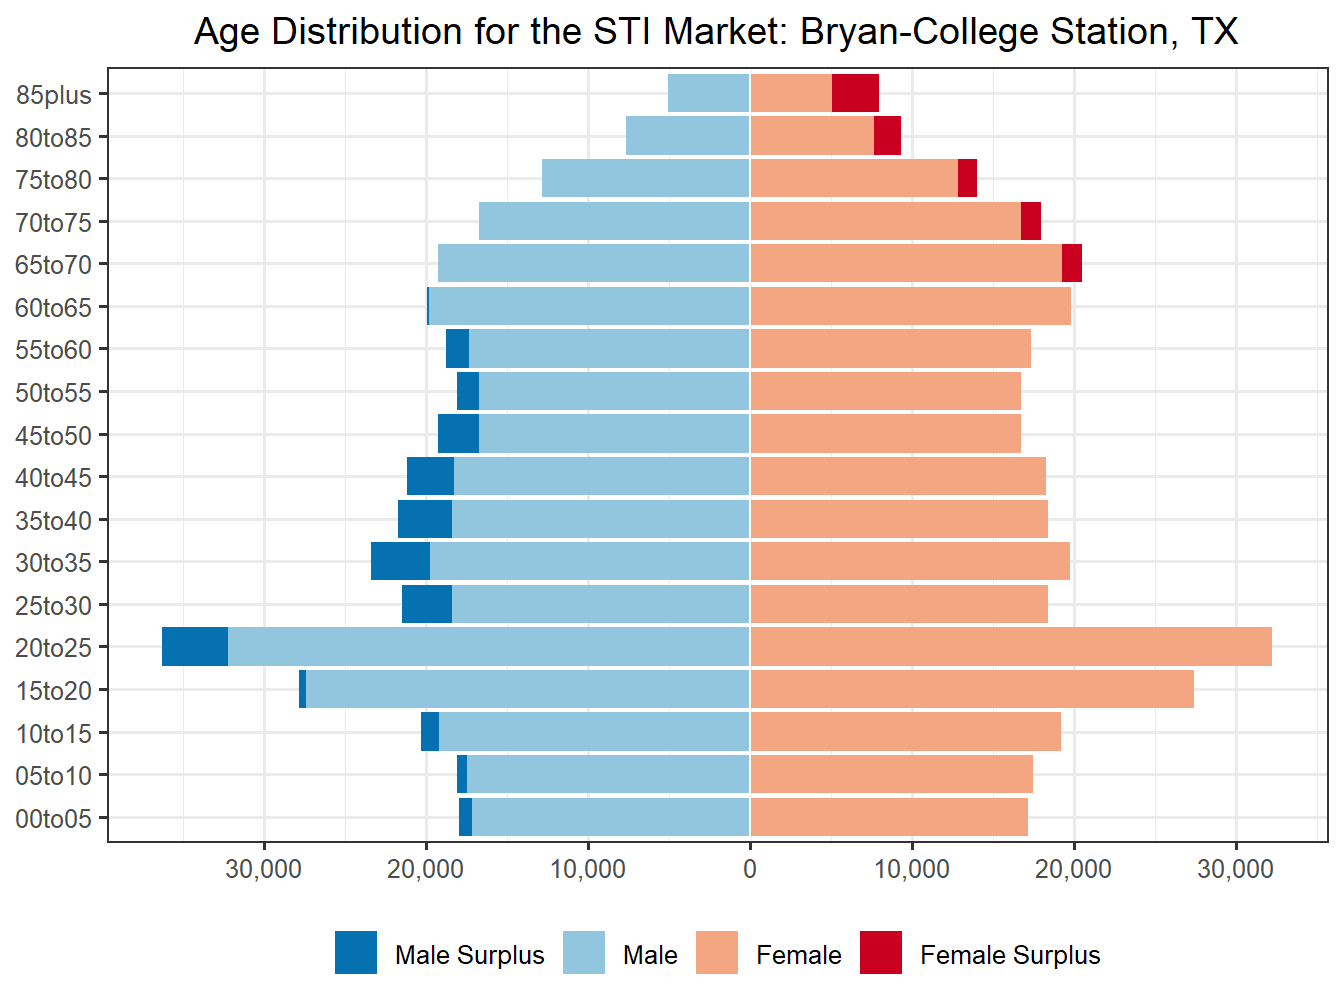
This report looks at the Age distribution of the Bryan-College Station, TX and quantifies the structure in to 9 possible categories. These are based on 2 scales, Dependency and Age Proportion Ratio of the Dependency. Dependency here is the ratio of dependent population, include older dependents over 65 and younger dependents under 15 compared to the 15 to 65 working age population. This measure is often used a way of quantify the amount of strain that the working age population might have in supporting those not working and is sometimes further refined to focus on only those currently working. In this case however we focus only on the age structure. The percentage that the young make up of the dependent population yields the Dependent Age Proportion, with a higher value indicating a younger population.
Market Age Structure Classification: Temporary Prosperity
The Bryan-College Station, TX market has a dependency ratio of 55.8 which is considered a Low level of dependency. The proportion of that dependent population that is under 15 is 46% and subsequently this market could be age wise considered Balanced. These two classifications in mind the Bryan-College Station, TX market falls in the Temporary Prosperity Age Structure Classification.
With a Low level of dependency and the age dependency balanced between young and old, this markets is likely to be currently prospering. With most of the population in their working years this market stands to increase its economic output with little in terms of elderly and young population to slow it down. Trouble might be on the horizon however as the dependency is likely to both increase and trend older as the current large working population ages. Out migration of retiring population or in migration of younger population would benefit this market. As would increased growth from a higher birth rate. In fact, out migration of older and younger populations might have already been occurring and may explain this regions current structure. Baring continued migratory effects this age structure is difficult to maintain long term. Hopefully this market can transition to a Stable structure or it risks falling into the less favorable Ageing Rapidly or Sunsetting age structure classifications.
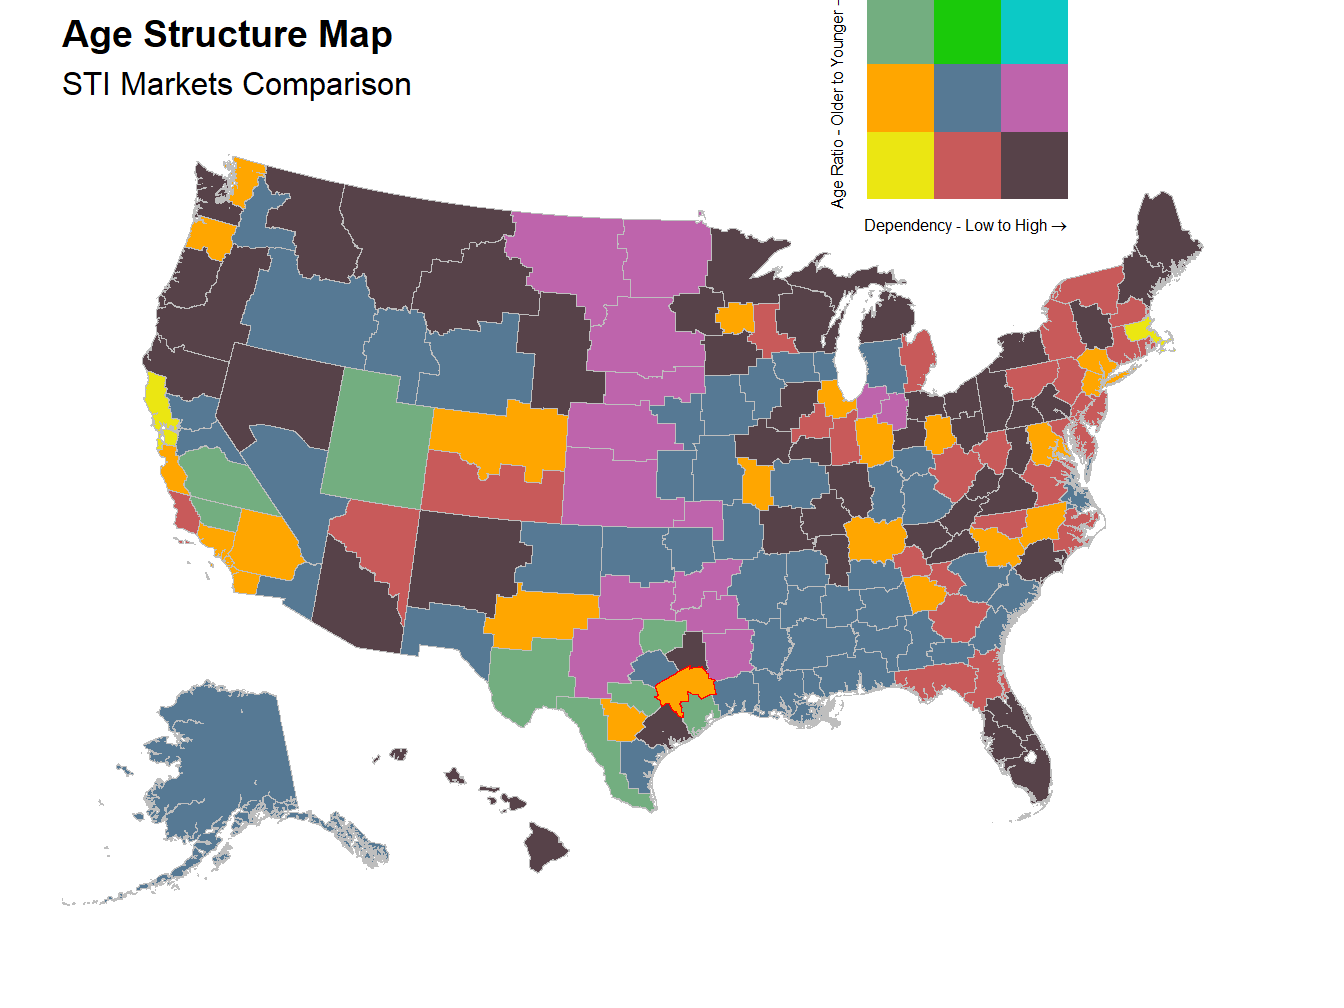
STI Markets Comparison - Age Chart
The lines on the following chart are the break points used for structure classifications. For dependency on the X axis they are 56 and 61. For the age proportion of younger dependents (out of young <15 and old dependents >65) on the Y axis they are at 55% and 45%.

Figure 17: Age Structure Classification for STI Markets