Economic Development in Top Growth Markets

GDP per capita in top growth markets is either slowly increasing, or not at all.

Economic Development in Top Growth Markets

GDP per capita in top growth markets is either slowly increasing, or not at all.

As shocking as it may sound, only 2 of the 5 top growth markets in the United States have a higher GDP per capita now than they did in 2007 after adjusting for inflation. Take a look at these 5 markets and how they compare to their states and the nation.

Running the Numbers

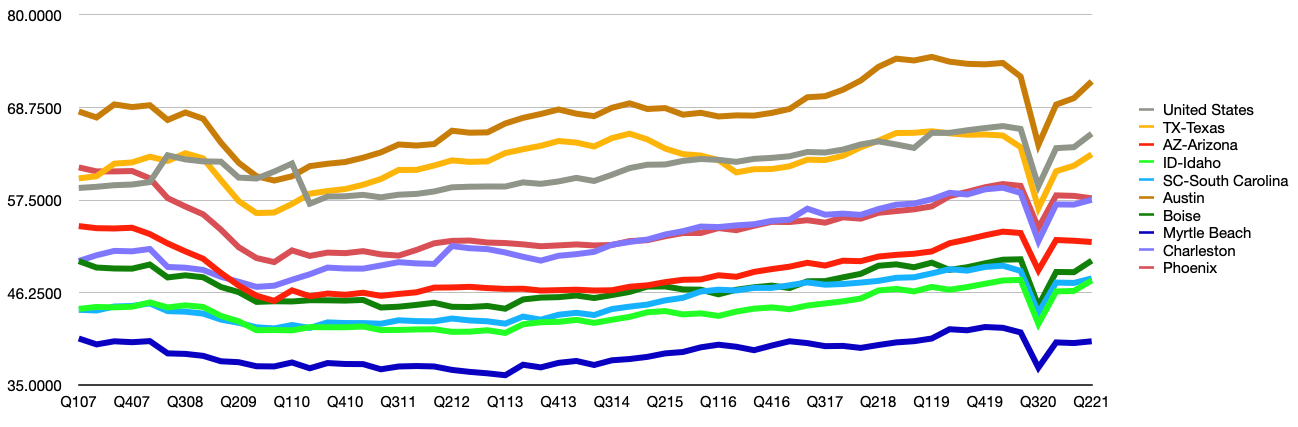
We derived this insight by tracking  GDP per capita using our GDP and population fields from 2007 to 2021. We then adjusted these numbers for inflation, based on BEA data, to create an accurate view of how these markets are progressing. The graph below shows how each market stacks up against each other, their states, and the nation (y-axis is in thousands):

gdp per capita adjusted for inflation line graph

There are several different ways GDP can be measured. Our GDP estimates are a GDI (Gross Domestic Income). This allows us to create estimates at a local level and is equivalent to GDP on larger levels. The following four incomes are considered: farm income, personal income, business income, and government income (taxes).

Diving Deeper

If you take a look at the spreadsheet above, the last column reveals that only one market (Charleston) has had a substantial amount of GDP per capita growth that also beat the nation. Two markets, Myrtle Beach and Phoenix, exhibited a decline in GDP per capita, and Boise is hardly displaying an increase. Two economic crashes occurring within the last 14 years are likely large contributing factors to these trends.

The inference that can be made is that the populations moving to these markets add a lower amount of per capita output than the starting per capita output level.

The October release for the July 2021 estimates is available now!

Learn More About PopStats